0 ITEMS

Step-by-Step Guide: Calculating Time to Break-Even

Time to break-even is the time until cumulative cash, starting at minus the launch investment, reaches zero, and it is found by dividing fixed costs by the profit each sale contributes, then stacking that result on a month-by-month ramp-up and the launch investment. In the worked example below, an illustrative cafe covers its monthly costs in month 4 and recovers its launch investment after 17.8 months, in US dollars and before financing, taxes and working capital.
Key Takeaways
- Monthly break-even volume equals fixed costs divided by contribution per sale, so every plan needs both numbers before any date can be estimated.
- Reaching monthly break-even does not recover the launch investment, because cumulative cash stays negative until early profits repay earlier losses.
- In the illustrative cafe (US dollars, before financing and taxes), a 90,000 launch cost and ramp-up stretch payback to 17.8 months, against 11.5 at full volume.
- The same cost logic fits any industry, but each reports a different measure, such as break-even volume, customer payback or simple payback.
- Rerun the model whenever price, cost or sales assumptions move, because the break-even date is a forecast rather than a fact.
What Time to Break-Even Actually Measures
Break-even has two meanings that are often mixed up. The break-even point is the sales level at which total cost and total revenue are equal, according to the U.S. Small Business Administration (SBA) startup cost guide. Time to break-even, a concept covered by the break-even models at eFinancialModels, is the time until cumulative cash, after the launch spend, reaches zero.
The wait can be long. The same SBA guide notes that some companies may take years before turning a profit. The U.S. Bureau of Labor Statistics (BLS) reported in its January 2024 data note that 34.7 percent of private-sector business establishments born in March 2013 were still operating in March 2023. That figure counts survival, not profit, but it shows why a founder needs a dated plan for covering losses. The same 2024 note adds that the survival rate dropped most in the first year of operation, falling by 20.4 percentage points.
Lenders and investors typically focus on the cash view. The payback period is the time needed to recover the cash invested in a project from the cash it generates, as the AccountingCoach payback guide describes it. This guide uses time to break-even for the time until cumulative cash, which starts at minus the launch investment, climbs back to zero while sales are still ramping up.
Step-by-Step: Calculate Time to Break-Even in Five Steps
- List your costs and split them in two. Fixed costs are bills that stay the same whatever the sales volume, such as rent and salaries. Variable costs rise with each sale, such as ingredients or card fees. Express fixed costs per month so every later number shares one time unit.
- Find the contribution per sale. Contribution per sale is the price minus the variable cost of one sale. It is the amount each sale leaves over to pay fixed costs, and dividing it by the price gives the contribution margin.
- Divide to find the break-even volume. Break-even volume per month equals monthly fixed costs divided by contribution per sale. Round up, because a fractional sale cannot happen and a rounded-down figure would leave a small loss.
- Model the ramp-up month by month. Few businesses open at full volume. Start with a realistic first-month volume, add a steady monthly increase, and cap it at what the location can serve. The first month in which volume passes the break-even line is the month the operation stops losing money.
- Add the launch investment and find the payback month. Start cumulative cash at minus the launch cost, then add each month’s operating profit. The first month in which the running total is zero or higher is the time to break-even. Interpolating inside that month gives a fractional estimate, and the payback period models at eFinancialModels use the same logic.
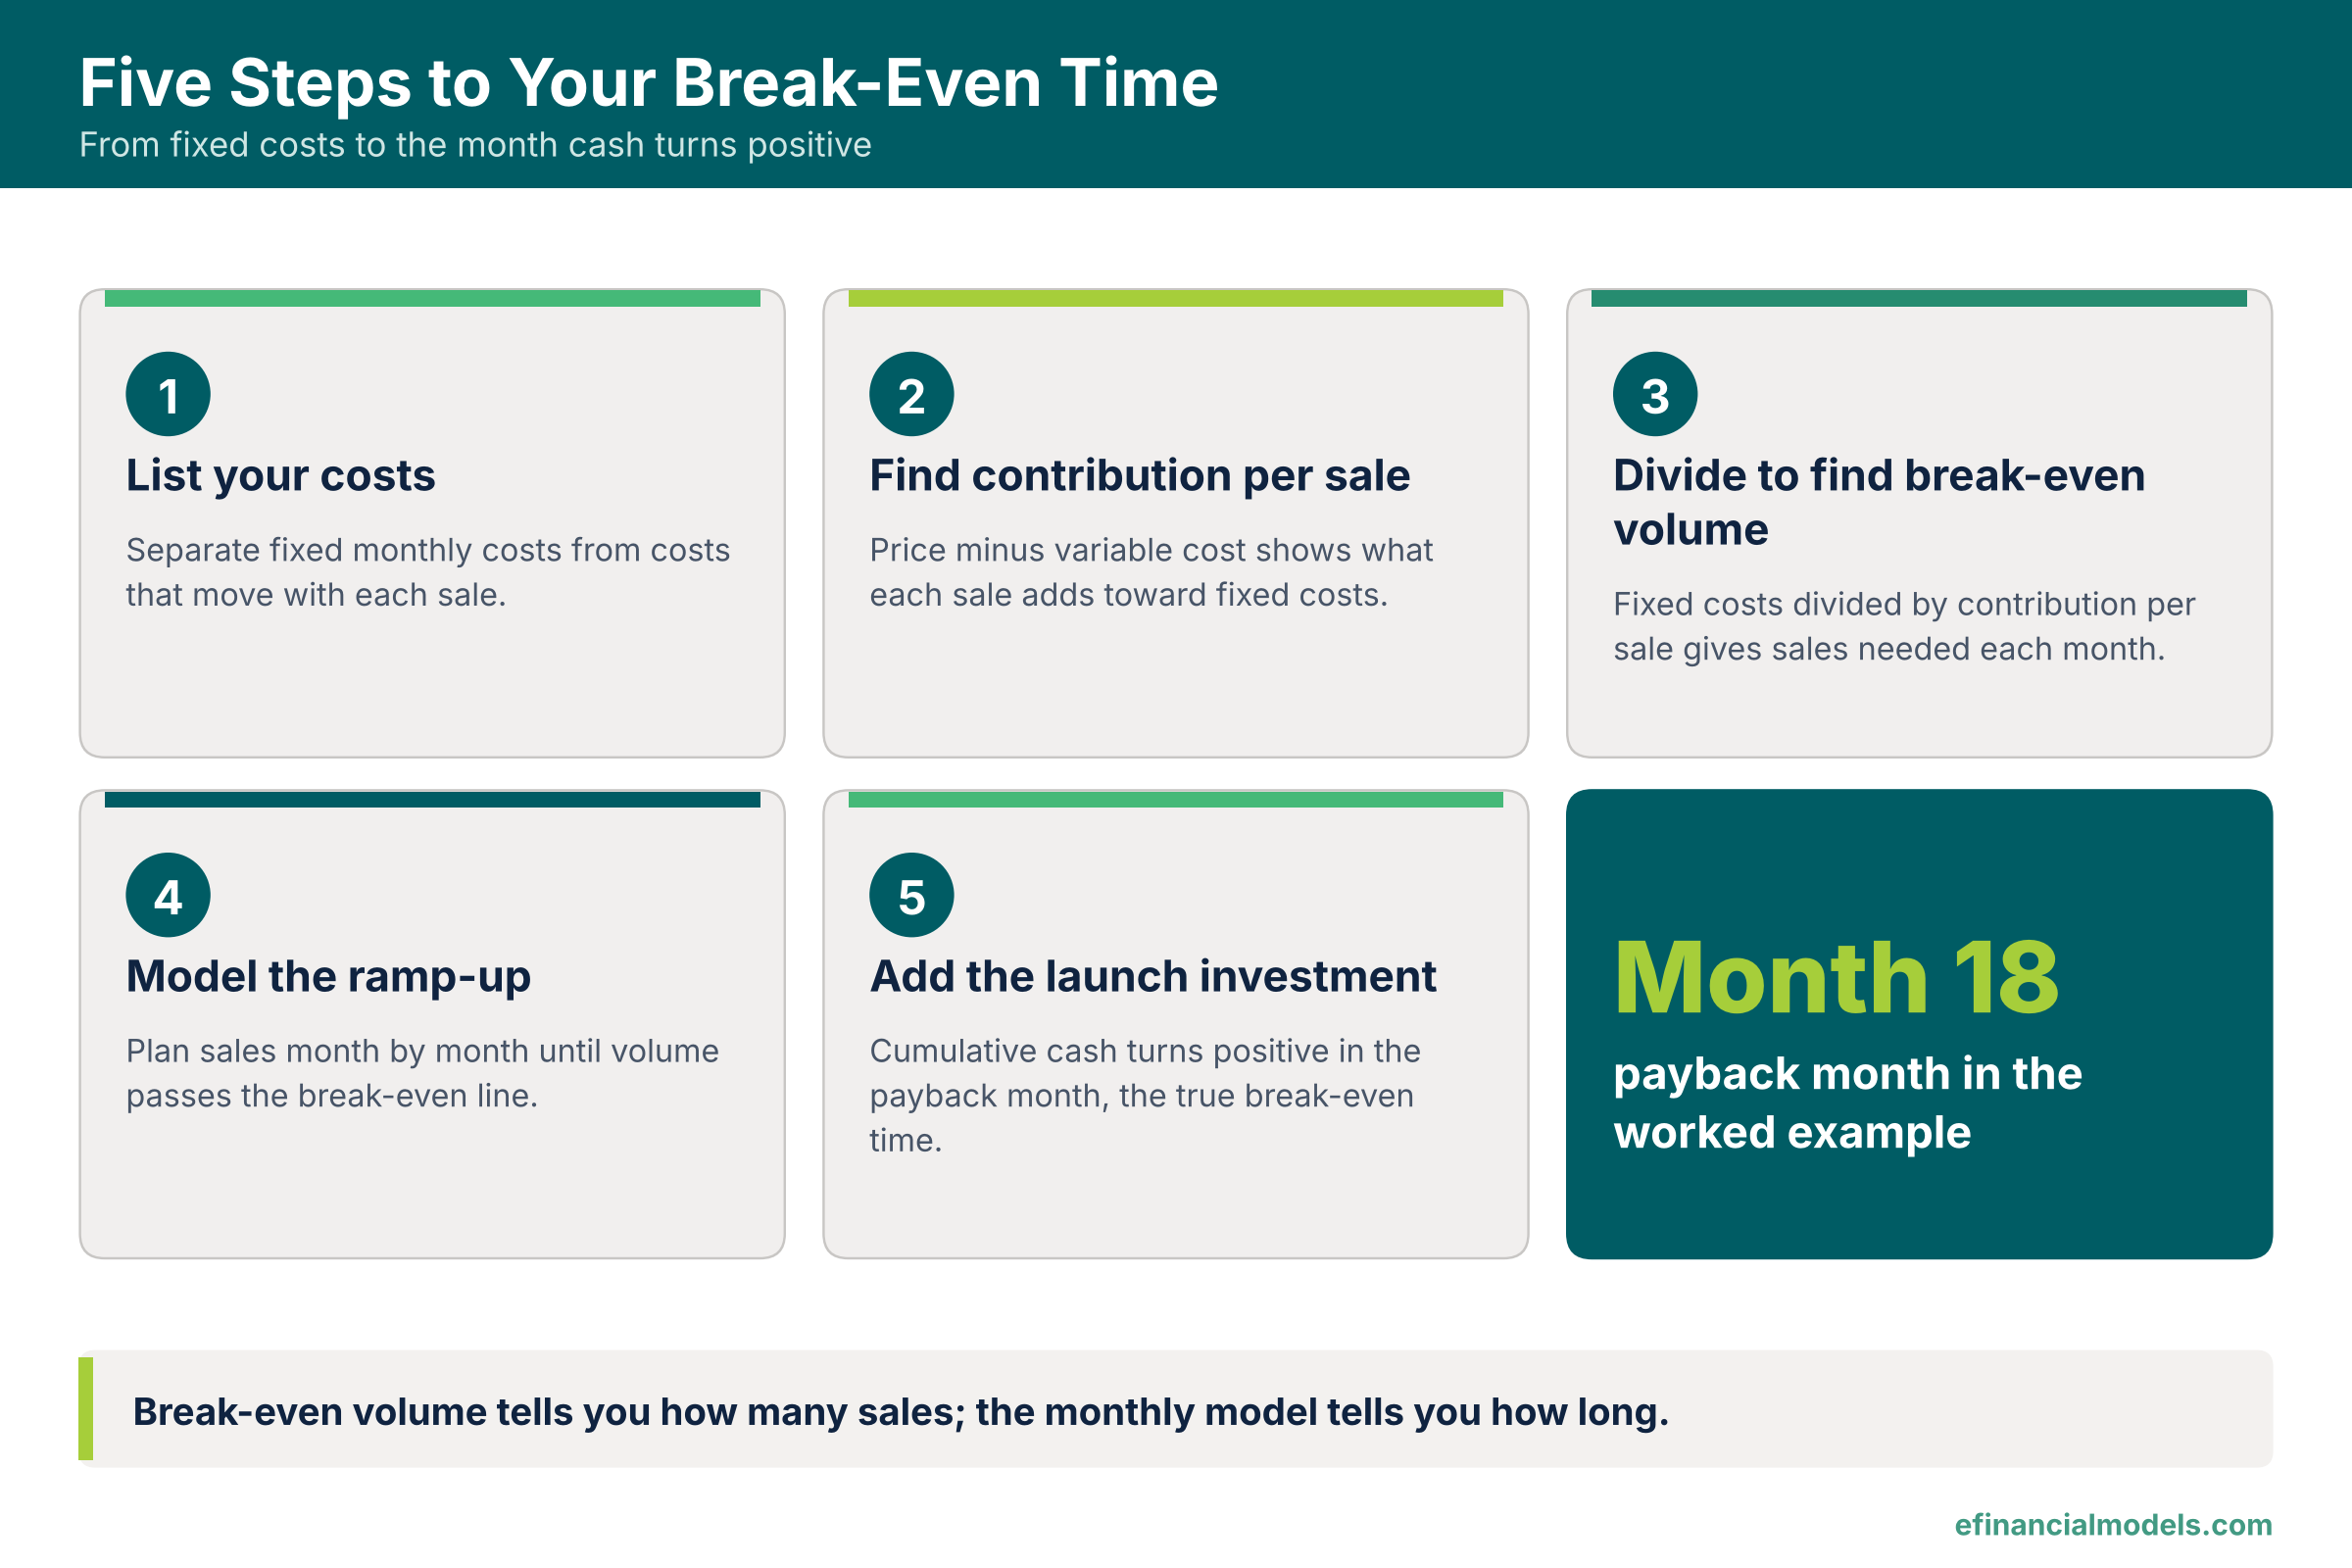
The five steps in order, drawn by eFinancialModels from the method described above.
Worked Example: An Illustrative Cafe
All amounts below are US dollars and every input is an illustrative assumption. Assume a fictional Example Cafe with a launch investment of 90,000, monthly fixed costs of 15,600, an average spend of 12.00 per visit and a variable cost of 4.20 per visit. Assume steady-state traffic of 3,000 visits per month, a first month of 1,200 visits and growth of 300 visits per month until traffic hits that cap.
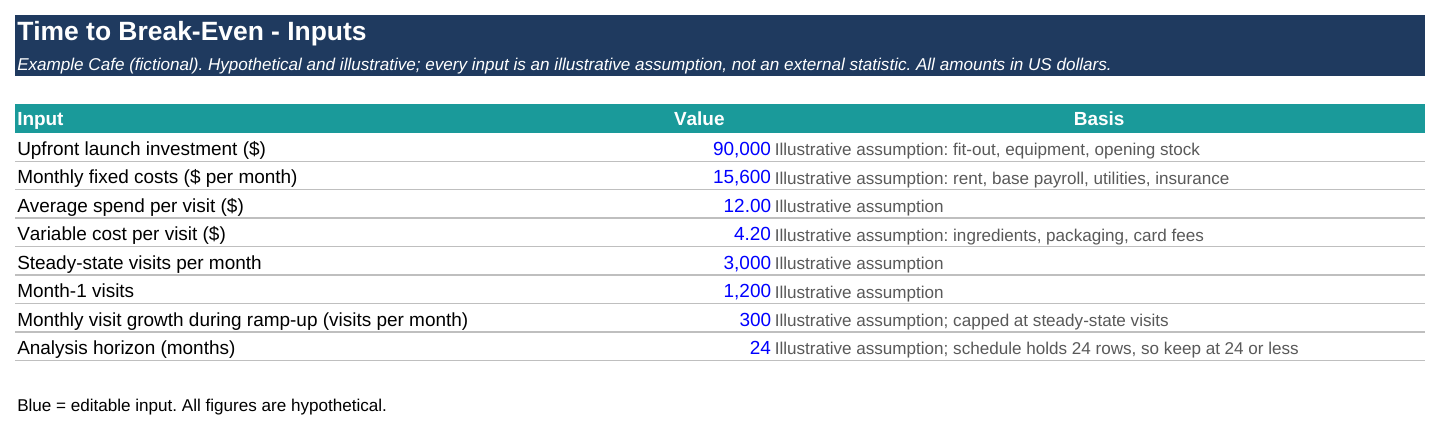
Every assumption sits on one input sheet, so changing a price or a cost updates the whole timeline. Source: eFinancialModels Analysis
Contribution per visit is 12.00 minus 4.20, or 7.80, which is a 65 percent contribution margin. Break-even volume is 15,600 divided by 7.80, or 2,000 visits per month, equal to 24,000 of monthly revenue. At the assumed 3,000 visits, the cafe sits 1,000 visits above that line, a margin of safety of 33.3 percent of steady-state traffic.
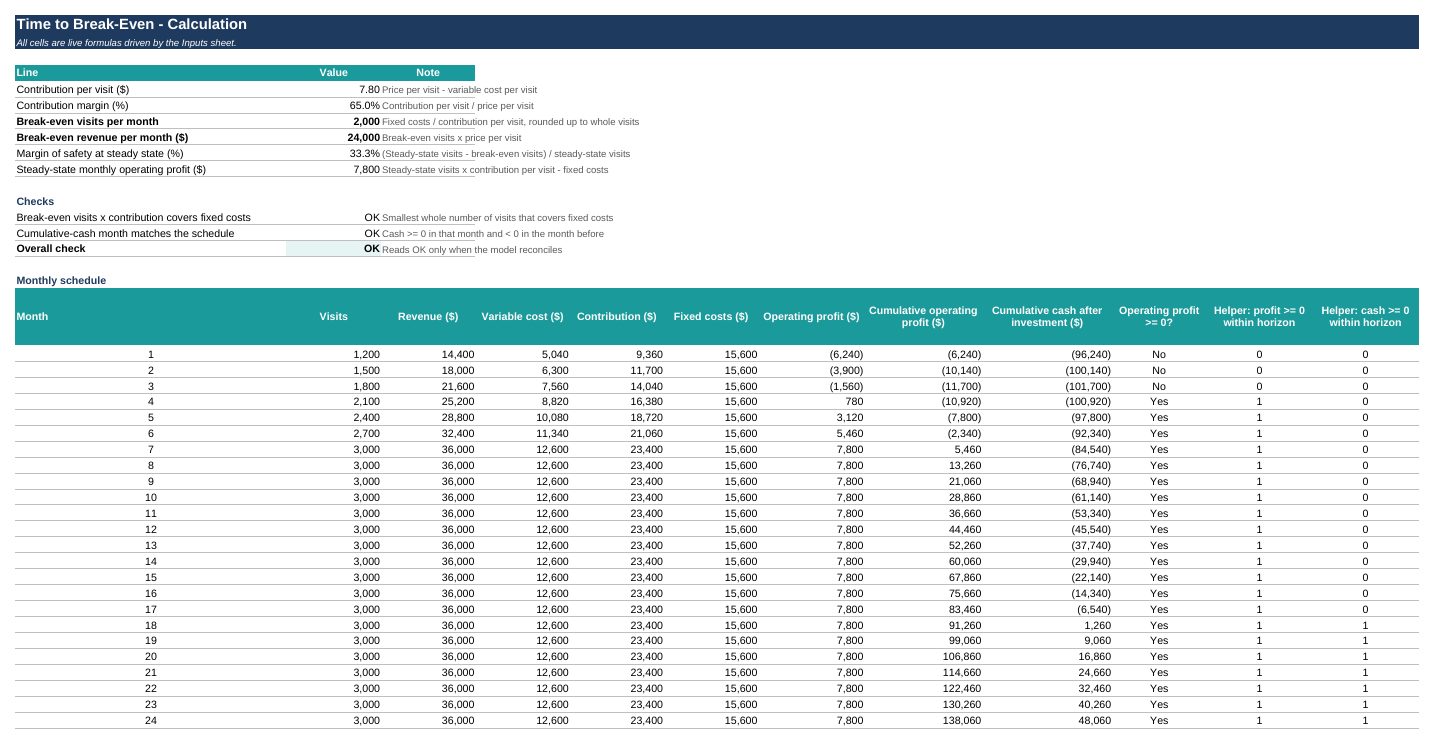
The monthly schedule shows operating profit turning positive in month 4 while cumulative cash keeps falling. Source: eFinancialModels Analysis
The schedule explains the timing. Visits run 1,200, 1,500, 1,800 and 2,100 in months one to four, so operating profit runs at minus 6,240, minus 3,900 and minus 1,560 in the first three months, then turns positive in month 4 at 780. The first three months lose 11,700 in total, so cumulative cash bottoms out in month 3 at minus 101,700, which is the 90,000 launch cost plus those losses. Profit then climbs to 7,800 per month from month 7, when traffic reaches 3,000 visits. Cumulative cash is still minus 6,540 after month 17. Month 18 adds 7,800 against a remaining gap of 6,540, so payback falls in month 18. Seventeen full months plus 6,540 divided by 7,800, or 0.84 of a month, gives 17.8 months.
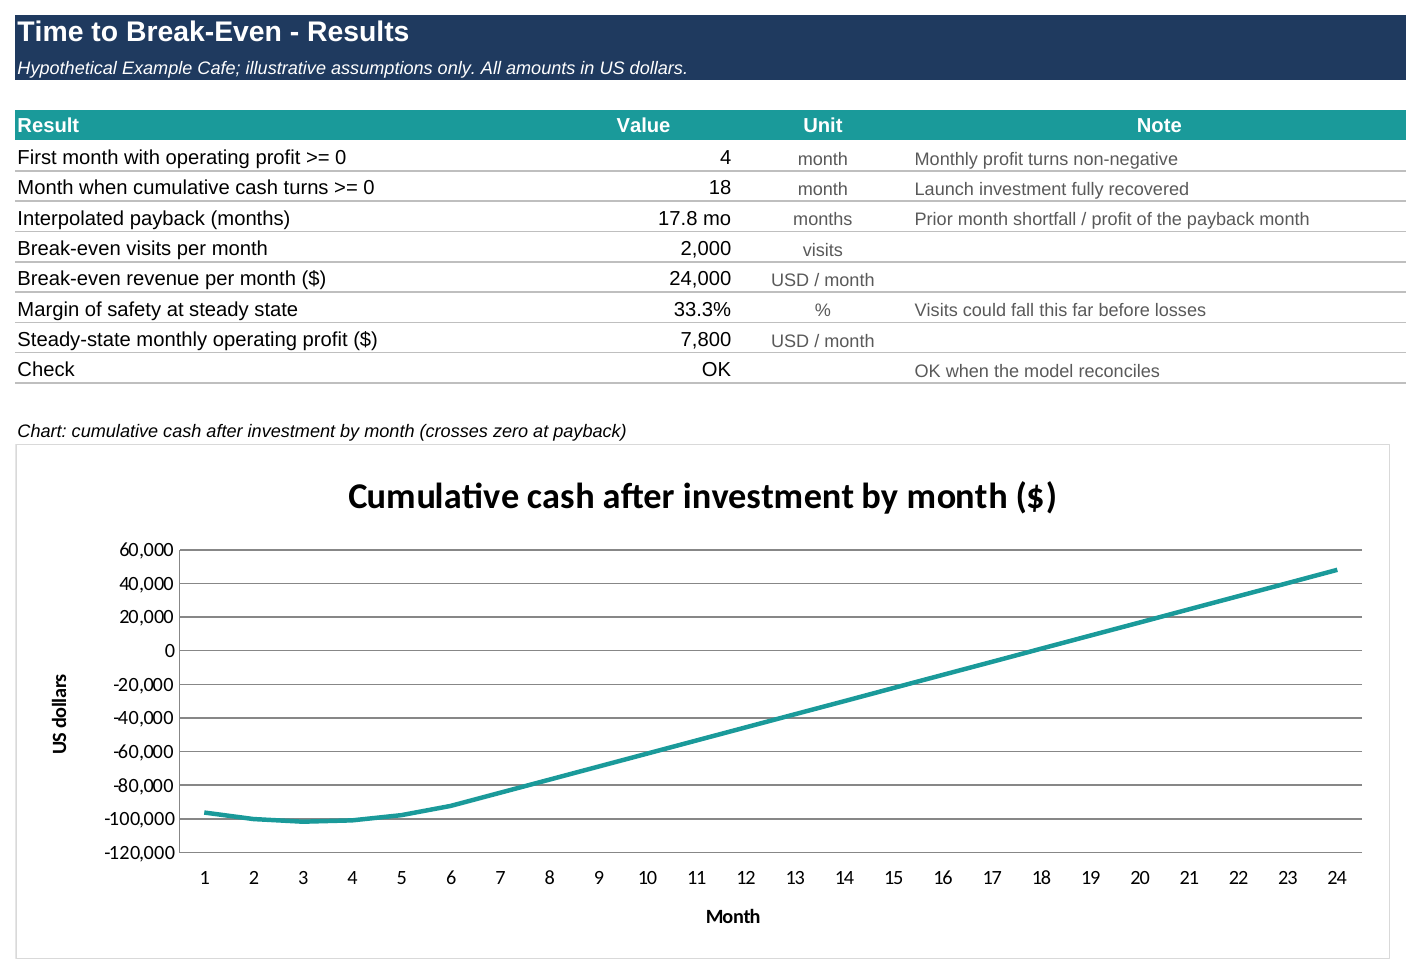
The results sheet marks the month-18 crossing and the headline figures, all calculated by live formulas. Source: eFinancialModels Analysis
A shortcut would mislead here. Dividing the 90,000 investment by the full-volume profit of 7,800 gives 11.5 months, which ignores the ramp-up. The ramp-up and its early losses add about 6.3 months, so the plan needs cash for a longer wait than the simple division suggests.
How the Calculation Differs by Industry
The cost logic carries across industries, but each industry reports a different measure, so the rows below are not directly comparable. Each row uses assumed, illustrative inputs and states the measure it shows.
| Industry | Assumed inputs | Calculation | Measure and result |
|---|---|---|---|
| Manufacturing | Fixed costs 40,000 per month; price 50 and variable cost 30 per part | 40,000 / (50 – 30) | Break-even volume: 2,000 parts per month, with no launch cost or timing |
| Software subscriptions | Customer acquisition cost (CAC) 600; subscription 100 per month at an assumed 80% gross margin | 600 / (100 x 0.80) | Customer payback: 7.5 months per customer, not company break-even |
| Rooftop solar | System cost 18,000; annual bill savings 2,400 | 18,000 / 2,400 | Simple payback with no ramp-up: 7.5 years |
| Cafe or restaurant | See the worked example | Month-by-month schedule | Cumulative-cash time to break-even: 17.8 months |
For software-as-a-service (SaaS) businesses, the payback of the customer acquisition cost (CAC), the sales and marketing spend needed to win one customer, is the usual yardstick. According to an Aleph summary of the Aleph x Benchmarkit SaaS and AI performance benchmarks, the 2026 edition of the benchmarks puts the median business-to-business software company at 16 months to recover its customer acquisition cost. That benchmark measures payback on winning one customer, not company break-even, and the assumed 7.5 months above would fall below the median, so a real plan should test its own inputs against such benchmarks. Gross margin, used in that row, is revenue minus the direct cost of delivering the service, as a share of revenue. For solar and other equipment projects, the simple payback divides the cost by yearly savings and ignores financing and equipment ageing, so it is a screening number only.
Frequently Asked Questions
Is the break-even date the same as the first profitable month?
No. The first profitable month marks the moment revenue exceeds running costs, while the break-even date waits until every earlier loss and the launch spend are repaid. In the example those two events are fourteen months apart. Lenders usually ask about the second, because it shows when borrowed or invested money starts to come back, whereas the first only shows that the operation has stopped bleeding.
How should loan repayments and taxes be treated?
Interest and principal are not operating costs, so the cleanest approach keeps them out of the contribution calculation and adds them as a separate monthly cash outflow below operating profit. Taxes work the same way once profit appears. Including them pushes the payback month later, so a plan that relies on borrowed money should run the schedule twice, once before financing and once after it, and compare the two dates.
What changes when sales are seasonal?
A flat monthly average hides the months that drain cash. Replace the single steady-state volume with twelve seasonal volumes, keep fixed costs constant, and read the cumulative cash line rather than the average. A business that earns most of its profit in one quarter can reach break-even on paper in a year yet still need a cash reserve to survive the quiet months before that quarter arrives.
How often should the calculation be updated?
Update it whenever a price, a supplier cost or the sales pace changes by a meaningful amount, and at least once a quarter in the first two years. Compare actual monthly visits or units against the plan; if actuals trail the ramp-up by two months, shift the whole growth curve and read the new payback month. Keep actuals on the same sheet as the plan.
How long is too long to wait for break-even?
There is no universal limit, because the answer depends on how much cash the owner can commit and how long the product or lease will last. Compare the payback month with the lease term, loan term or equipment life. A payback that lands near the end of those periods leaves little room for error, so a lower launch cost or a higher price deserves a look before any money is committed.
Conclusion
Time to break-even comes from three inputs: the break-even volume, a realistic ramp-up and the launch investment. Readers who want to test their own project can use the eFinancialModels Payback Period Calculator, an Excel template for working out how long it takes to recover an investment, before committing capital to a launch.