
0 ITEMS

Growth Metrics: Understanding ARR Waterfall

ARR Waterfall tracks how subscription-based revenue changes over time, providing clear insights into business growth.
Understanding this metric helps identify the impact of new sales, expansions, contractions, and churn on overall revenue.
Accurate calculation requires monitoring starting ARR, adding expansion revenue, and subtracting churn and downgrades.
Visualizing ARR movements reveals trends, highlights areas for improvement, and supports strategic planning.
Using ARR Waterfall analysis can improve forecasting and guide decisions to boost recurring revenue and sustain growth.
Deconstructing ARR Waterfall
Business growth often feels like a mystery. But with the right tools, it’s like a puzzle waiting to be solved. ‘Deconstructing ARR Waterfall’ is all about piecing together this complex picture. It explains how businesses earn and predict their income over time. Understanding this topic drives success for subscription-based models. Let’s dive in!
The Basics Of Annual Recurring Revenue
Annual Recurring Revenue (ARR) is the backbone of any subscription service. ARR shows the money a company can expect every year from customers. To get this number, companies add up all subscription fees. They count these fees as if they will keep coming in every year. This helps companies plan their future better.
- It’s predictable: Firms can guess their future income.
- It’s stable: Once customers sign up, they usually stay.
- It shows growth: Increasing ARR means the company is growing.
Why ARR Waterfall Is Essential
An ARR Waterfall breaks down the overall ARR. It shows changes in revenue over time. Each drop in the waterfall is a different kind of change.
| New Sales | Expansions | Contractions | Churn |
|---|---|---|---|
| Money from new customers | Extras current customers buy | Cuts in what customers pay | When customers leave |
This ‘waterfall’ helps in key ways:
- Spot trends: See what areas are doing well, or not.
- Plan ahead: Forecast and set goals with precision.
- Improve: Make changes to boost growth areas.
ARR Waterfall Components
Understanding the journey of Annual Recurring Revenue (ARR) is crucial for any SaaS business. The ARR Waterfall Components are stepping stones that show how revenue evolves over time. Let’s dive into each of these components and see how they shape the overall health of a subscription-based company.
Starting ARR
The Starting ARR sets the stage for the fiscal period. It’s the initial marker of your revenue stream. This number represents how much recurring revenue you begin with at the start of the year or month before any new business comes into play.
Expansion Revenue
Expansion Revenue signals growth. When existing customers buy more services or upgrade their plans, your ARR sees positive momentum. It includes:
- Upgrades to higher plans
- Additional purchased features
- Cross-sells to other products
Contraction And Churn
On the other side, we face Contraction and Churn. Contraction occurs when customers downgrade. Churn happens when they leave altogether. Together, these reduce your ARR and indicate areas for improvement. They are reflected in:
| Contraction | Churn |
|---|---|
| Downgraded subscriptions | Cancelled subscriptions |
| Decreased user seats | Non-renewals |
Ending ARR
Finding the Ending ARR helps you understand the net result. Subtract the contraction and churn from your starting ARR plus expansion revenue. This number shows whether your business is expanding or contracting overall. It includes:
- Calculation from starting ARR
- Addition of expansion revenue
- Deduction of contraction and churn
Calculating Growth Using ARR Waterfall
Tracking business growth is crucial. The Annual Recurring Revenue (ARR) Waterfall captures this. It shows changes in recurring revenue over time. This method is visual and insightful. Let’s dive into the calculation.
Step-by-step Calculation
To calculate ARR accurately, follow these steps:
- Start with initial ARR: Begin with your starting ARR at the period’s beginning.
- Add new ARR: Include revenue from new customers acquired.
- Add expansion ARR: Add revenue from existing customers who upgraded.
- Subtract churned ARR: Deduct revenue lost from customers who left.
- Subtract contraction ARR: Deduct revenue lost from downgrades.
- Total ARR: Combine these for the total end-period ARR.
The formula looks like this:
Ending ARR = Starting ARR + New ARR + Expansion ARR – Churned ARR – Contraction ARR
Common Mistakes To Avoid
Stay clear of these common pitfalls:
- Not updating regularly: Update ARR calculations often to stay accurate.
- Ignoring small changes: Small numbers impact the big picture. Track all changes.
- Mixing one-time and recurring revenue: Only include recurring revenue to maintain clarity.
- Failing to segment: Breaking down ARR by customer type gives deeper insights.
Interpreting ARR Waterfall Data
Analyzing the flow of Annual Recurring Revenue (ARR) offers valuable insights into a business’s financial health. Under the ‘Interpreting ARR Waterfall Data’ section, we dive into how to dissect this crucial metric. Let’s understand what each movement in revenue signifies and how it can hint at underlying growth patterns.
Analyzing Revenue Movements
Reading an ARR Waterfall chart seems tricky at first. It’s a visual representation of revenue changes. The goal is to spot various trends that impact your ARR through the year. To simplify, focus on increases and decreases separately:
- New business: Fresh contracts contribute to rising ARR.
- Expansion: Current customers buying more means growth.
- Contraction: A decline due to downgrades or reduced usage.
- Churn: Revenue lost when a customer parts ways.
Each bar on the chart speaks to a specific change. Positive bars signal gains, while negative ones indicate losses. Grasping these movements is like reading a story of how your business fares over time.
Identifying Growth Patterns
Spotting patterns in the ARR data shines a light on where your business is headed. Here’s what to look for:
- Detect spikes in new business to gauge marketing success.
- Examine expansion revenue for customer loyalty clues.
- Scrutinize contractions for possible product issues.
- Analyze churn rates for service improvement areas.
Regular patterns suggest a predictable and stable revenue stream. Conversely, drastic ups and downs might indicate volatility. Pinpointing these trends will inform data-driven business decisions and strategy adjustments.
ARR Waterfall In Action
An ARR Waterfall shows how recurring revenue evolves over time. It breaks down changes in Annual Recurring Revenue by different factors. These factors include new sales, expansions, contractions, and churn. Visualizing this helps teams spot trends and issues quickly.
Case Studies: Successful Implementations
- SaaS Company A used ARR Waterfall to pinpoint churn hotspots. They improved customer retention by 20%.
- Technology Firm B tracked new sales, learning which products drove growth. Sales increased by 30% year-over-year.
- Startup C identified and expanded high-value customer segments. Their ARR grew by 40% in two quarters.
Leveraging ARR For Strategic Decisions
Businesses use ARR Waterfall charts to make smart choices. The charts guide where to invest and show if strategies work.
| Time Period | New Sales | Expansion | Contraction | Churn | Net ARR Growth |
|---|---|---|---|---|---|
| Q1 | $50k | $20k | -$5k | -$10k | $55k |
| Q2 | $60k | $25k | -$7k | -$8k | $70k |
Companies use data from the ARR Waterfall to:
- Boost customer success efforts.
- Align sales and product development.
- Forecast and set realistic growth targets.
Future-proofing Your Business With ARR Insights
Annual Recurring Revenue (ARR) is not just a metric; it’s a compass that guides businesses towards long-lasting success. Understanding your ARR can help you anticipate and adapt to market changes. Smart use of ARR data leads to informed decisions, ensuring your company remains robust and competitive. Let’s explore how mastering ARR insights can secure your business’s future.
Predicting Trends With ARR
ARR isn’t just about today’s numbers; it’s a crystal ball into your company’s future. By analyzing ARR patterns, you unlock the ability to forecast shifts in your revenue stream. This foresight enables you to proactively make strategic decisions. It keeps your business aligned with customer needs and market demands.
- Market Adaptability: Spot trends early on.
- Customer Engagement: Tailor services to match evolving preferences.
- Resource Allocation: Invest in areas showing potential growth.
Continuous Growth Through ARR Optimization
Optimizing your ARR is like nurturing a garden; regular attention leads to thriving growth. Focused efforts to improve ARR support sustained business expansion. Continually optimizing pricing, packaging, and customer success strategies keeps businesses ahead of the curve.
| Strategy | Action | Outcome |
|---|---|---|
| Pricing | Refine pricing models | Increased revenue per customer |
| Packaging | Bundle products/services | Better customer retention |
| Customer Success | Enhance support systems | Improved customer satisfaction |
Frequently Asked Questions
What Is The ARR Waterfall Model?
The ARR Waterfall Model refers to the allocated revenue recognition method where revenue gets recognized in a linear, step-by-step process over time.
How Is ARR Growth Calculated?
ARR growth is calculated by subtracting the previous period’s Annual Recurring Revenue (ARR) from the current period’s ARR, then dividing the result by the previous period’s ARR and multiplying by 100 to get a percentage.
What Is ARR In Growth Equity?
ARR in growth equity stands for Annual Recurring Revenue, indicating predictable revenue that a company expects to receive each year from customer subscriptions.
What Is ARR Metrics?
ARR, or Annual Recurring Revenue, is a key performance metric that reflects the yearly recurring revenue from subscriptions or services. It’s crucial for assessing a company’s financial health in subscription-based business models.
Conclusion
Navigating the complexities of ARR Waterfall metrics is crucial for any business focused on growth. Armed with this knowledge, you can better track recurring revenue and forecast future performance. Let’s embrace these insights to shape flourishing strategies and propel our financial success to new heights.
Remember, understanding leads to mastery.


The SaaS Business financial model offers valuable assistance in preparing a budget and multi-year financial plan for a Software as a Service (SaaS) bu... read more


Average rating:Submit Rating
Model for in depth understanding of high level profit and loss and revenue analysis. Big-4 like checklist of due diligence analyses. This Financial Du... read more


Advanced 10-year financial model for a Software as a Service (SaaS) business providing a solid financial foundation to evaluate scalability, optimize ... read more

Average rating:Submit Rating
The SaaS Business Financial Model helps founders, entrepreneurs, consultants, analysts, and business owners build a structured financial plan for a so... read more

Professional Realtors need a professional Toolkit which allows them to operate at a higher level. The ALL-IN-ONE Quintessential Real Estate Toolkit in... read more
SaaS Dashboard Template created in Excel spreadsheet format to assist SaaS Startups to track core SaaS metrics and polish their businesses. Instant do... read more

This is a collection of financial model templates for businesses in the Information technology Industry and its related sectors including SaaS, Mobile... read more


Solar Farm Excel Model Template is an excellent tool to assess the financial feasibility of a proposal to Build and Operate a Solar PV Farm/Plant or a... read more
Average rating:Submit Rating
The SaaS Business Financial Model helps founders, entrepreneurs, consultants, analysts, and business owners build a structured financial plan for a so... read more
Average rating:Submit Rating
Financial model providing a dynamic 10-Year Financial Plan for an Equipment Leasing Company


Average rating:
A comprehensive editable, MS Excel spreadsheet for tracking Virtualization Software Company finances, integrates Income Statements, Balance Sheets, &a... read more

Average rating:Submit Rating
The Vitamin Subscription Box Financial Model helps entrepreneurs, founders, consultants, analysts, and business owners turn a subscription-based suppl... read more

Average rating:Submit Rating
Financial model providing a dynamic 10-Year Financial Plan for a Boutique Gym.

Financial Model providing a 10-year financial plan for a startup or operating Video in Demand/Over-the-top Streaming Platform.

Average rating:Submit Rating
The Development Property Valuation calculator is suitable for accurately analysing development opportunities and projects. The Financial analysis make... read more

Average rating:Submit Rating
The Online Class Subscription Financial Model helps entrepreneurs, founders, consultants, analysts, and business owners build a structured forecast fo... read more

10-Year Financial Model for a Social Media Platform, designed to support strategic planning, monetization analysis, and growth forecasting.


The best financial model for a Resort business. Unlock the true potential of your luxury resort with our comprehensive financial model, designed to dr... read more

Average rating:Submit Rating
A comprehensive editable 5 Year 3 Statement, MS Excel spreadsheet for tracking Digital Advertising Agency company finances, including yearly Online an... read more

Average rating:
This is a detailed and easy-to-use Software-as-a-Service (SaaS) financial model. This is a modular financial model meaning that relevant calculations ... read more

Average rating:Submit Rating
Analyse the Start or Expansion of a Building Equipment Hire Business with Cash Flow Statements, Income Statements and Balance Sheets automated for you... read more

The Beauty Subscription Box Financial Model helps founders, entrepreneurs, consultants, analysts, and business planners turn a beauty box concept into... read more

A comprehensive editable, 5-year 3 statement MS Excel spreadsheet for tracking Software Developers' finances, including an MRR Subscription version, a... read more

A comprehensive editable, MS Excel spreadsheet for tracking Indoor Rock Climbing Gym finances, Income and Cash Flow Statements, and Balance Sheets giv... read more

Average rating:
This Catering and or Catering Equipment for HIRE Business and Financial Model will assist you in arriving at accurate and validated decisions about ei... read more

A comprehensive editable, 5-year 3 statement MS Excel spreadsheet for tracking Swimming School finances, including an MRR Subscription version, and su... read more

Average rating:Submit Rating
5-Year Financial Model providing advanced financial & planning analysis for a Health and Fitness Club.

Average rating:Submit Rating
The Cleaning Service Financial Model helps entrepreneurs, founders, consultants, analysts, and business owners turn a cleaning business idea into a st... read more


A free, intuitive and simple to use SaaS financial model template in Google Sheets for B2B companies. It helps you easily forecast your company’s fu... read more


Average rating:Submit Rating
An easy-to-use and customizable financial modelling template that covers all the key areas of investment, costs, profits, loss and sustainability in t... read more


Average rating:Submit Rating
Unleash the power of precise, customizable forecasting with Pro Financial Forecast, the advanced yet user-friendly financial modeling template that ca... read more

Average rating:Submit Rating
A comprehensive, editable MS Excel spreadsheet for tracking health club finances, including yearly summary tabs, Subscription tracking. Integrates Inc... read more

In today's digital era, data holds great importance, and having a dependable inventory tracking system is crucial for businesses striving for operatio... read more

Average rating:
Pro Forma Models created this financial model to calculate and analyze the pro forma indicative return from a Core Single-Family (SFR) Build to Rent ... read more


The model is designed to make it easier for SaaS founders to use it effectively to scale their start-up.

Average rating:Submit Rating
This model can be used to analyze the financial return of a franchisor business using a 3 statement model.
Average rating:Submit Rating
Comprehensive, editable, 5-year 3-statement MS Excel spreadsheets for tracking CRM Software Developers' finances, including a Subscription version. In... read more

Average rating:Submit Rating
Introducing the Badminton Court and Club Forecasting Model, a visionary ally for unparalleled success in the badminton arena. Seamlessly blending cohe... read more

Average rating:Submit Rating
A comprehensive editable, MS Excel spreadsheet for tracking Physiotherapy Clinic finances, integrates Income Statements, Balance Sheets, & Cash Fl... read more

Average rating:Submit Rating
Comprehensive editable, MS Excel spreadsheets for tracking consulting firm finances. Including a version for subscription-based revenue and developmen... read more
Pro Forma Models created this model to prepare and analyze a start-up or existing Software as a Service (SaaS) business plan forecast that incorporate... read more

Average rating:Submit Rating
Pro Forma Models created this model to analyze the financial return of a franchise business using a 3 statement model. The pro forma tab includes all ... read more
Pro Forma Models created this model to prepare and analyze a start-up or existing mobile application (app) business plan forecast that incorporates a ... read more

Average rating:Submit Rating
A comprehensive editable, 5-year 3 statement MS Excel spreadsheet for tracking Virtual Reality Software Developers' finances, including an MRR Subscri... read more

Average rating:Submit Rating
A comprehensive editable, MS Excel spreadsheet for tracking private Mental Health Centre finances, integrates Income Statements, Balance Sheets, &... read more

Average rating:Submit Rating
This is a comprehensive editable, 5-year 3-statement MS Excel spreadsheet for tracking SaaS HR Software Development finances. It includes an MRR Subsc... read more

Average rating:Submit Rating
A comprehensive editable, MS Excel spreadsheet for tracking private Medical Center finances, including development channels, and summary tabs, integra... read more

This B2B SaaS Financial Model Template (Income Statement, Balance Sheet, Cash Flow, DCF Valuation, SaaS Metrics & Ratios) features specific SaaS m... read more

Average rating:Submit Rating
A comprehensive editable, 5-year 3 statement MS Excel spreadsheet for tracking Start up Company finances, including an MRR Subscription. Income Statem... read more
Average rating:Submit Rating
A model to prepare and analyze a start-up or existing eCommerce business. It incorporates the pre-sale launch period using a 3 statement model and key... read more

A comprehensive editable, MS Excel spreadsheet for tracking Data Center finances, including development channels, and summary tabs, integrates Income ... read more

Average rating:Submit Rating
Unlock your B2B SaaS venture's full potential with our B2B SaaS Financial Model & Valuation Template. This model helped startups raise seed fundin... read more
Average rating:Submit Rating
Pro Forma Models created this model to analyze the financial return of acquiring an existing real estate brokerage company (M&A), operating an ex... read more

This Pre-Seed SaaS Financial Model Template has been built for use by any company founder or executive in the Pre-Seed SaaS space, Investors or Analys... read more

Average rating:Submit Rating
Optimize your Subscription-based B2C SaaS startup's financial planning with our comprehensive SaaS Financial Model template. This model helped startup... read more

This Yoga Studio Financial Model Template has been built for use by any company founder or executive in the Yoga Studio space, Investors or Analysts l... read more
A comprehensive editable, 5-year 3-statement MS Excel spreadsheet for tracking B2B Services Company finances, including an MRR Subscription version. I... read more

Average rating:Submit Rating
The SaaS B2C Business Financial Model for Irregular Renewal Periods is designed to help SaaS companies accurately forecast revenue despite unpredictab... read more

Average rating:Submit Rating
Tailored ecommerce financial model Model for startups. It includes detailed revenue projections, cost breakdowns, financial statements, and key metric... read more

Average rating:Submit Rating
A comprehensive editable, 5-year 3 statement MS Excel spreadsheet for tracking Digital Marketing Agency finances, including an MRR Subscription versio... read more

Average rating:Submit Rating
A comprehensive, editable, 5-year 3 statement MS Excel spreadsheet for tracking SAAS Development Service finances, including a Subscription version, a... read more

A comprehensive editable, 5-year 3 statement MS Excel spreadsheet for tracking Graphic Design Company finances, including an MRR Subscription version,... read more

Average rating:Submit Rating
Very comprehensive 5-Year 3 Statement Excel Financial Model bundle for a Streaming Service. Includes version for subscription-based revenue. Income, C... read more
This Mobile App Financial Model Template has been built for use by any company founder or executive in the Mobile App space, Investors or Analysts loo... read more

This E-Commerce Mobile App Financial Model Template has been built for use by any company founder or executive in the E-Commerce Mobile App space, Inv... read more

A comprehensive editable, 5-year 3 statement MS Excel spreadsheet for tracking Mobile App Developers' finances, including an MRR Subscription version,... read more

This Gym Financial Model Template has been built for use by any company founder or executive in the Gym space, Investors or Analysts looking at resear... read more

This 10-year monthly Gym Fitness Center financial model is designed to assess a gym startup's financial viability by forecasting monthly and annual fi... read more
Average rating:Submit Rating
Human Resource Management (HR / HRM) SaaS Financial Model Template has been built for use by any company founder or executive in the HR / HRM SaaS spa... read more
Average rating:Submit Rating
This SaaS Financial Model Template has been built for use by any company founder or executive in the SaaS space, Investors or Analysts looking at rese... read more

This Fintech Financial Model Template has been built for use by any company founder or executive in the Fintech space, Investors or Analysts looking a... read more

This Hair Salon Financial Model Template has been built for use by any company founder or executive in the Hair Salon space, Investors or Analysts loo... read more


Maximize your real estate investment potential with our Private Equity Excel Financial Model. It offers comprehensive projections over 8 years, coveri... read more
Average rating:Submit Rating
This Customer Relationship Management (CRM) SaaS Financial Model Template has been built for use by any company founder or executive in the CRM SaaS s... read more
Average rating:Submit Rating
This Enterprise Resource Planning (ERP) SaaS Financial Model Template has been built for use by any company founder or executive in the ERP SaaS space... read more
Subscription-Based B2C SaaS Financial Model Template has been built for use by any company founder or executive in the Subscription-Based B2C SaaS spa... read more
Average rating:Submit Rating
This Payment Gateway and Billing Solutions SaaS Financial Model Template has been built for use by any company founder or executive in the Payment Gat... read more

This Healthcare Mobile App Financial Model Template has been built for use by any company founder or executive in the Healthcare Mobile App space, Inv... read more

Average rating:Submit Rating
This Student Bundle includes financial model templates from various industries that Students may be interested in learning about and seeing how each B... read more
This Seed SaaS Startup Financial Model Template has been built for use by any company founder or executive in the Seed SaaS space, Investors or Analys... read more
This E-Commerce SaaS Financial Model Template has been built for use by any company founder or executive in the E-Commerce SaaS space, Investors or An... read more

A comprehensive editable, MS Excel spreadsheet for tracking Dog Grooming Business finances. Income Statements, Balance Sheets, & Cash Flow Stateme... read more

Our comprehensive financial model for infrastructure construction projects offers detailed cash flow, P&L, balance sheet analysis, scenario planni... read more

This Fitness Center Financial Model Template has been built for use by any company founder or executive in the Fitness Center space, Investors or Anal... read more

Average rating:Submit Rating
Very comprehensive editable, MS Excel spreadsheets for tracking Digital Education Company finances, including MRR channels, and summary tabs, with Inc... read more

This Accounting SaaS Financial Model Template has been built for use by any company founder or executive in the Accounting SaaS space, Investors or An... read more
This Series A SaaS Startup Financial Model Template has been built for use by any company founder or executive in the Series A SaaS space, Investors o... read more

Average rating:Submit Rating
The Mobile App Financial Model Template is a comprehensive tool designed for app developers, entrepreneurs, and financial professionals to project rev... read more
This Project Management SaaS Financial Model Template has been built for use by any company founder or executive in the Project Management SaaS space,... read more
Average rating:Submit Rating
This Content Management System (CMS) SaaS Financial Model Template has been built for use by any company founder or executive in the CMS SaaS space, I... read more

This Marketplace Financial Model is a dynamic and comprehensive Excel template built to evaluate and forecast the financial performance of any online ... read more

Average rating:Submit Rating
Comprehensive editable, 5 Year 3 statement MS Excel spreadsheets for tracking Medical Resort finances, including an MRR Subscription version, summary ... read more

This Communication Platform SaaS Financial Model Template has been built for use by any company founder or executive in the Communication Platform Saa... read more

A comprehensive, editable, 5-year 3 statement MS Excel spreadsheet for tracking aerial drone photography business finances, including a Subscription v... read more

Average rating:Submit Rating
A comprehensive editable, 5-year 3 statement MS Excel spreadsheet for tracking Graphic Design Software Developers finances, including an MRR Subscript... read more

Optimize your fintech payment business’s financial planning with our Fintech Payment Financial Model Excel Template. Designed for payment solution p... read more

Average rating:Submit Rating
A comprehensive editable, 5-year 3 statement MS Excel spreadsheet for tracking SEO Agency finances, including an MRR Subscription version, and summary... read more

Comprehensive editable, 5-year 3 statement MS Excel spreadsheets for tracking Tool Manufacturer finances. Income Statements, Balance Sheets, & Cash Fl... read more
The Video Streaming Financial Model Template is a comprehensive tool designed for startups and existing platforms to plan, forecast, and analyze finan... read more

This Excel model is an adaptable and user-friendly tool designed to create a comprehensive 5-year financial projection for all-day restaurants. With a... read more

Average rating:Submit Rating
Tailored for BNPL platform operators, fintech entrepreneurs, and financial analysts, this powerful tool empowers you to forecast revenues, manage cost... read more


This fully unlocked 5 Year, 12-tab institutional-grade Excel template is engineered to help founders and finance teams precisely forecast capital runw... read more


A professional, investor-ready Mobile App Financial Model with monthly-to-annual projections over 5 years. Built for subscription or in-app monetizati... read more
A premium, investor-ready SaaS Financial Model (Excel) built for founders, finance teams, and advisors.

This dynamic Early Stage Startup SaaS Financial Model, built by an FMVA-certified expert, offers a ready-to-use, user-friendly Excel template for B2C ... read more


Average rating:
The ultimate 5-year SaaS financial model for startups. Build a fully automated financial plan in an hour—track revenues, expenses, cash flow, and ke... read more

A polished, investor-ready E-commerce Financial Model for DTC and marketplace stores. It includes a fully linked 3-statement model, a dynamic revenue ... read more
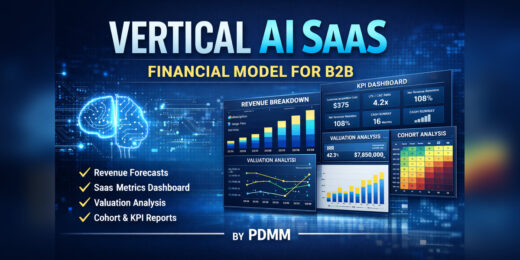
Professional Vertical AI SaaS Financial Model Template for B2B businesses in Excel. Includes 5-year monthly and annual forecasts, integrated 3-stateme... read more

The basis to build a financial model tailored to any type of business.

A ready-to-use Excel Daycare School Financial Model Template delivering 5-year pro-forma projections, flexible revenue modeling, and fully automated 3... read more

🚀 Premium Creator Economy Multi-Platform Revenue Financial Model, A professional financial model built for creators, influencers, educators, p... read more

The E-Commerce Financial Model is an integrated 10-year operating model that transforms raw assumptions—like website traffic, conversion rates, and ... read more

Average rating:Submit Rating
Give this workbook one row per customer per month and it returns the full retention picture: cohort triangles for MRR and for customer counts, logo an... read more

🔥 Premium AI / LLM Company Valuation Financial Model A professional financial model built for AI startups, LLM companies, foundation model bus... read more


Average rating:Submit Rating
Buying a wealth-management book or RIA? Underwrite it the way an SBA lender will. The broker prices the book at 2.2x recurring revenue ($4.18M); the b... read more

Average rating:Submit Rating
A 5-year, fully editable Excel model built specifically for AI automation and AI services agencies. It captures how agencies actually earn — monthly... read more

A three-year monthly financial model for AI SaaS startups, built around the cost structure that classical SaaS templates do not have: inference cost t... read more
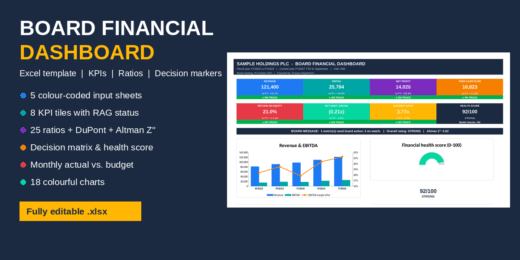

A board-ready Excel dashboard that turns key financial statement figures into a one-page view for directors and investors. How it works: You enter fiv... read more
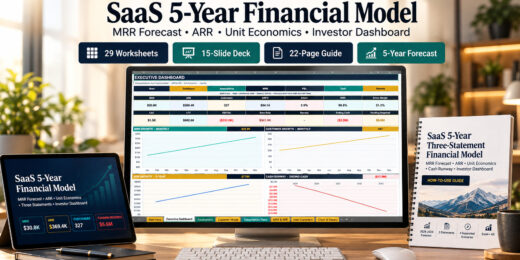

Professional 5-year SaaS financial model in Excel for subscription-based businesses, founders, financial analysts, and consultants. The 29-worksheet w... read more
An institutional-grade 10-year Excel financial model template for AI GPU-as-a-Service (GPUaaS) and AI compute data center startups. Features dynamic G... read more
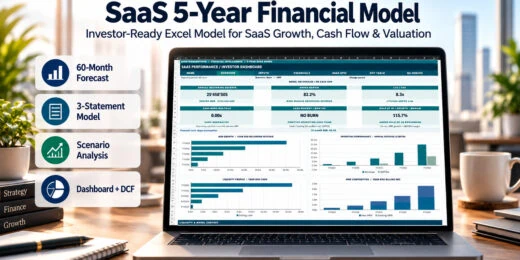
A comprehensive 5-year SaaS financial model with 60 monthly forecasts, 22 linked worksheets, customer cohort analysis, MRR/ARR forecasting, churn and ... read more
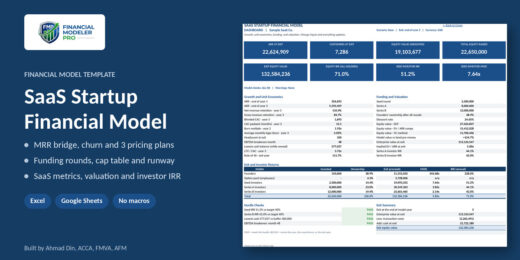

Plan a subscription software company month by month for five years, from the build phase before launch to the exit. The model covers three pricing pla... read more

eFinancialModels Team
Content Manager
The eFinancialModels Team showcases the combined expertise of seasoned professionals in financial modeling, valuation, and business analysis. Our goal is to share practical knowledge, insights, and best practices drawn from real-world experience across industries such as renewable energy, real estate, SaaS, manufacturing, and finance.
Through our articles and templates, we aim to make complex financial modeling concepts accessible and actionable—helping entrepreneurs, investors, and finance professionals make smarter business decisions.


