
0 ITEMS

Mastering Business Finance: The Three-Statement Financial Model

This article is written by AUT Financial Modeling
A solid financial model is essential for understanding and planning your company’s future performance.
- The Three-Statement Financial Model integrates the Income Statement, Balance Sheet, and Cash Flow Statement for a complete financial picture.
- It provides key insights into revenue, expenses, and cash flow, helping you make informed decisions.
- Scenario analysis allows you to test different business conditions, from sales growth to cost changes.
- Features like breakeven analysis and financial ratios support strategic planning and risk assessment.
- Using these tools helps you navigate uncertainties and set realistic targets for growth and profitability.
Continuing will give you practical approaches to leverage this powerful financial modeling tool effectively.
The Significance of Financial Models
Financial models are the unsung heroes of modern business. They provide a structured framework for comprehensively analyzing and projecting a company’s financial performance. Among these models, one stands as a beacon of insight and precision: the Three-Statement Financial Model. This powerful tool amalgamates three fundamental financial statements—namely, the Income Statement, Balance Sheet, and Cash Flow Statement.
Embarking on a Journey of Financial Empowerment
This blog is your gateway to unraveling the potential and prowess of a Three-Statement Financial Model. Here’s why you should embark on this journey with us:
1. Gaining a Holistic Financial Insight
The Three-Statement Financial Model is not merely a ledger of numbers; it is a narrative of your company’s financial journey. By encapsulating the revenue dynamics, resource allocation patterns, and cash flow nuances, this model offers a panoramic view of your business’s financial health. It paints a vivid picture of how your company generates income, manages resources, and keeps the cash flow engine humming. Armed with this comprehensive insight, you’ll make decisions rooted in a profound understanding of your company’s financial ecosystem.
2. Empowering Decision-Making with Data-Driven Precision
In the realm of business, decisions carry weight, and the weight of a decision can determine the course of an enterprise. The Three-Statement Financial Model arms you with precision instruments for decision-making. It’s like having a financial GPS that not only tells you where you are but also guides you to where you want to be. From setting realistic revenue targets to identifying opportunities for cost optimization, this model turns financial data into a compass, allowing you to navigate your business with confidence and clarity.
3. Fortifying Against Uncertainties with Scenario Planning
The business world is a dynamic arena where uncertainties lurk around every corner. This is where the Three-Statement Financial Model becomes your shield. It empowers you to not only foresee potential challenges but also proactively devise strategies to mitigate them. Through scenario analyses, you can simulate a range of business landscapes, from economic downturns to unforeseen expenses. This foresight equips you to navigate potential hurdles with poise and precision, turning uncertainties into opportunities for growth.
Features That Transform Decision-Making
Now, let’s embark on a journey through the features that distinguish the Three-Statement Financial Model as an indispensable tool for businesses of all sizes and industries. From the Executive Summary that distills complex data for high-level executives to the Breakeven Analysis that unveils the threshold of profitability, each feature is a pillar of financial acumen.
This blog is your passport to unlocking the full potential of the Three-Statement Financial Model. Join us as we navigate through its features, decode its capabilities, and unearth the transformative power it holds for businesses worldwide. Get ready to make decisions that don’t just shape your business but revolutionize it.
Features of the Three-Statement Financial Model
We will be using AUT Financial Modeling‘s Three Statement Model Template as an example reference for our topic below:
1. Executive Summary

The Executive Summary serves as a condensed overview of the most crucial financial data points. It’s designed for high-level executives who need to quickly grasp the state of the company’s finances. This section typically includes:
Key Performance Indicators (KPIs): Metrics like Revenue, Gross Margin, Operating Expenses, Earnings Before Interest and Taxes (EBIT), Net Profit, and Earnings Before Interest, Taxes, Depreciation, and Amortization (EBITDA) are summarized for quick reference.
Financial Highlights: This could include significant achievements, milestones, or challenges faced during a specific period.
Comparative Analysis: A comparison of current financials with previous periods or industry benchmarks may be included to provide context and perspective.
2. Dashboard
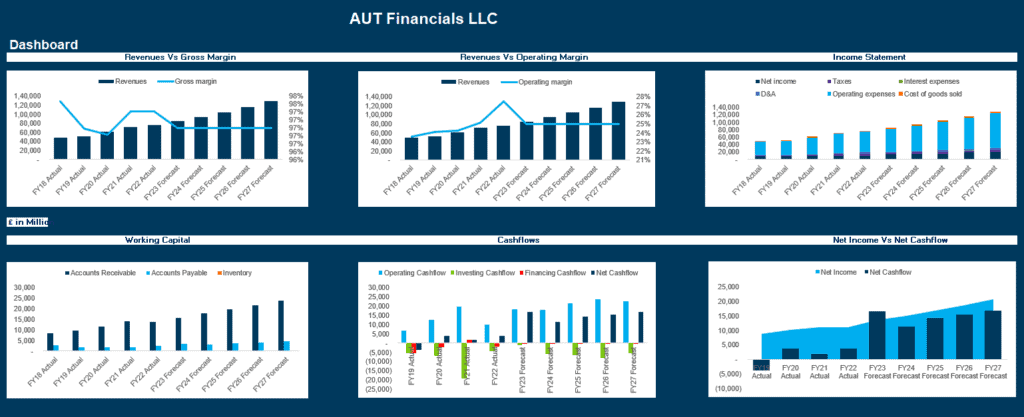
The Dashboard is a visually intuitive tool that presents critical data points in the form of charts and graphs. It offers a dynamic and engaging way to track performance trends. Key components of the Dashboard include:
Revenue Trends: Line charts displaying revenue trends over time, allowing for quick assessment of growth or decline.
Expense Breakdown: Pie charts or bar graphs showing the composition of operating expenses, helping identify areas for cost optimization.
Cash Flow Analysis: Visual representation of cash inflows and outflows, aiding in understanding liquidity.
Profitability Metrics: Charts illustrating profit margins, providing insights into the company’s overall financial health.
3. Financial Ratios
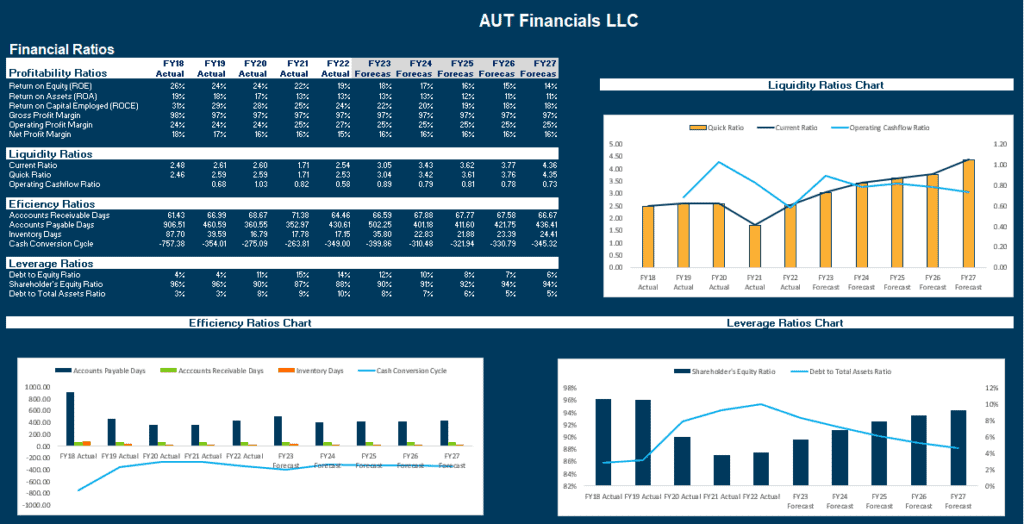
Financial ratios are essential tools for evaluating the performance and financial stability of a company. The model includes a comprehensive set of ratios, such as:
Liquidity Ratios: Like Current Ratio and Quick Ratio, which assess the company’s ability to meet short-term obligations.
Solvency Ratios: Including Debt-to-Equity Ratio and Interest Coverage Ratio, providing insights into the company’s long-term financial stability and debt management.
Profitability Ratios: Such as Return on Assets (ROA) and Return on Equity (ROE), indicating the company’s efficiency in generating profits from its assets and equity.
4. Breakeven Analysis

One of the paramount features of the Three-Statement Financial Model is the Breakeven Analysis. This tool is instrumental in understanding the point at which your business reaches a state of financial equilibrium—where total revenues equal total expenses. In essence, it unveils the minimum level of sales required to cover all costs, ensuring your business doesn’t operate at a loss.
Components of Breakeven Analysis
Fixed Costs: These are the expenses that remain constant regardless of the level of production or sales. They include expenses like rent, salaries, insurance, and depreciation. In the Three-Statement Financial Model, you can input these fixed costs, allowing the model to calculate their impact on your breakeven point.
Variable Costs: These expenses fluctuate in direct proportion to the level of production or sales. They encompass costs like raw materials, direct labor, and variable overheads. By inputting variable costs in the model, you gain insight into how they affect your breakeven point.
Breakeven Point (in Units): This is the quantity of products or services you need to sell to cover all your costs. It’s calculated by dividing the total fixed costs by the contribution margin per unit (i.e., the revenue generated per unit minus variable costs per unit).
Breakeven Point (in Sales Revenue): This represents the monetary value of sales needed to cover all expenses. It’s obtained by multiplying the breakeven point in units by the selling price per unit.
5. Input and Assumptions Sheets

The Input and Assumptions Sheets in the Three-Statement Financial Model serve as the foundation upon which the entire financial model is built. They provide a dynamic platform for users to customize and tailor the model to their specific business circumstances. Here’s a detailed explanation of their significance:
Input Sheets:
The Input Sheets are where you input the raw data and specific details about your business operations. These sheets act as the starting point for the financial model, allowing you to populate essential information that drives the calculations and projections. The following are key components of the Input Sheets:
Revenue Inputs: Here, you’ll provide details on how your company generates revenue. This may include product or service pricing, sales volume projections, and any other relevant revenue streams.
Expense Details: This section captures all the costs associated with running your business. This includes operating expenses, fixed costs, variable costs, and any other expenses pertinent to your industry.
Operating Assumptions: This section is where you can specify any assumptions or parameters related to your business operations. For example, you might set assumptions regarding sales growth rates, production costs, or pricing strategies.
Capital Expenditures: If your business involves significant investments in assets like machinery, equipment, or infrastructure, this section allows you to outline these expenses.
Taxation and Depreciation: Details about tax rates and depreciation methods are essential for accurate financial modeling.
Assumptions Sheet:
The Assumptions Sheet provides a centralized location to document and track all the assumptions made during the financial modeling process. This is crucial for transparency, accountability, and for understanding the basis on which financial projections have been made. Here’s what the Assumptions Sheet typically includes:
Sales Assumptions: This section outlines the assumptions made about sales growth rates, seasonality, and any other factors influencing revenue projections.
Expense Assumptions: Details about assumptions regarding operating expenses, including any anticipated changes or trends.
Market Assumptions: If your business is affected by external market factors (such as inflation rates, interest rates, or industry trends), this section allows you to document these assumptions.
Capital Expenditure Assumptions: Any assumptions related to investments in assets, including their timing and impact on operations.
Funding and Financing Assumptions: Details about assumptions regarding sources of funding, interest rates, and repayment schedules.
Tax and Regulatory Assumptions: Assumptions related to tax rates, tax incentives, or any changes in tax laws.
6. Interconnected Financial Statements
The Interconnected Financial Statements feature in the Three-Statement Financial Model is akin to the beating heart of this comprehensive tool. It embodies a fundamental principle of accounting: that the three core financial statements – the Income Statement, Balance Sheet, and Cash Flow Statement – are intrinsically linked, with changes in one affecting the others. Here’s a detailed look at how this feature operates within the context of this model:
In the Three-Statement Financial Model, these three statements are intricately connected. When you make a change in one statement, it has a ripple effect on the others. For example:
Revenue Increase on the Income Statement: If you increase the projected revenue in the Income Statement, it will lead to a higher Net Income.
Effect on Cash Flow: An increase in revenue will likely lead to higher collections from customers, which directly impacts the operating cash flow in the Cash Flow Statement.
Impact on Balance Sheet: With higher revenue and increased collections, the company’s cash position on the Balance Sheet will rise, indicating a stronger liquidity position.
Working Capital Changes: If the company is expecting higher sales (as reflected in the Income Statement), it may need to increase its accounts receivable, which will affect current assets on the Balance Sheet.
Capital Expenditure: If the company plans to expand its operations in response to increased sales, it may need to invest in capital assets. This will be reflected in the Cash Flow Statement under investing activities and will also affect the Balance Sheet by increasing fixed assets.
Dynamic Sensitivity:
This interconnection is dynamic, meaning that any change made in one statement is instantaneously reflected in the others. This ensures that the financial model remains balanced and accurate at all times. It’s a critical feature for businesses, as it prevents discrepancies and ensures that financial projections align cohesively across all statements.
Scenario Analysis:
This interconnectedness is particularly valuable for scenario analysis. You can model different scenarios, such as higher sales growth, increased operating expenses, or changes in financing, and immediately see the ramifications on all three statements. This empowers you to make more informed decisions by understanding how different variables impact your financial performance.
7. Beta Calculation and DCF Valuation
In the context of the Three-Statement Financial Model, the Beta Calculation and DCF Valuation features provide advanced insights for businesses, particularly those that are publicly listed.

Beta Calculation
What is Beta?
Beta is a measure of a stock’s risk in relation to the overall market. It indicates how sensitive a stock’s returns are to changes in the market. A beta of 1 means the stock is expected to move in line with the market, while a beta greater than 1 implies higher volatility, and a beta less than 1 suggests lower volatility.
How It Benefits Your Financial Model:
Incorporating Beta in the financial model allows you to gauge the relative risk associated with your company’s stock compared to the broader market. This information is critical for investors and financial analysts as it helps them understand the potential risks and returns associated with investing in your company.
DCF Valuation (Discounted Cash Flow Valuation)

What is DCF Valuation?
DCF Valuation is a method used to estimate the value of an investment based on its expected future cash flows. It works on the principle that the value of money today is worth more than the same amount in the future due to its potential to earn interest or returns.
How It Benefits Your Financial Model:
By incorporating DCF Valuation, the financial model provides an estimation of the intrinsic value per share of the company. This is a crucial metric for both potential investors and current stakeholders. It gives them a sense of what the company is truly worth based on its expected future cash flows. This information can guide investment decisions, negotiations, and financial planning.
Integration with the Three-Statement Model
In the Three-Statement Financial Model, the Beta Calculation and DCF Valuation features are seamlessly integrated. Here’s how they work together:
Data Integration: The model gathers relevant financial data, including historical stock prices, market indices, and financial statements of the company.
Beta Calculation: Using this data, the model calculates the Beta for your company. This metric indicates the stock’s sensitivity to market movements.
DCF Valuation: The model then employs the DCF Valuation method, taking into account projected future cash flows, discount rates, and growth rates. This results in an estimated intrinsic value per share.
Presentation: The calculated Beta and DCF Valuation are presented in a clear and accessible format within the model’s output. This information is invaluable for potential investors, financial analysts, and stakeholders.
Benefits for Stakeholders
Investors: Beta and DCF Valuation provide valuable insights for investors looking to understand the risk-return profile of investing in your company. It helps them make informed decisions about whether to invest or divest.
Financial Analysts: These metrics are crucial for financial analysts who are tasked with evaluating and valuing companies for investment purposes. It enhances their ability to provide accurate and insightful analyses.
Management and Board of Directors: Understanding Beta and DCF Valuation allows the management and board to communicate effectively with shareholders and potential investors, providing a clear picture of the company’s value and risk profile.
By incorporating Beta Calculation and DCF Valuation, the Three-Statement Financial Model not only provides a comprehensive view of your company’s current financial health but also equips stakeholders with vital information for making investment decisions with confidence and precision.
8. Scenario Analysis Charts

In the dynamic world of business, foresight is as invaluable as hindsight. Scenario Analysis, a cornerstone of the Three-Statement Financial Model, empowers you to peer into the future, enabling better-prepared decisions in the present. This feature enables you to model a range of potential scenarios and assess their impact on your financial statements.
Understanding Scenario Analysis
Scenario Analysis involves constructing multiple financial projections based on different hypothetical situations. These scenarios could range from best-case to worst-case scenarios, encompassing various factors such as market conditions, customer behavior, and economic trends. By running these simulations, you gain critical insights into how your business might fare under different circumstances.
Video Walkthrough:
Key Components of Scenario Analysis in the Three-Statement Financial Model
1. Cashflows Scenario Analysis
This component allows you to project how different scenarios may affect your cash flows. For instance, you can model scenarios where sales increase due to a successful marketing campaign or where there’s a temporary disruption in the supply chain causing delayed payments.
2. Revenue Scenario Analysis
Revenue is the lifeblood of any business. This feature enables you to evaluate how variations in sales volumes or prices could impact your top line. For instance, you can model scenarios where there’s a surge in demand for your products or services or where a competitive market exerts pressure on pricing.
3. EBITDA Scenario Analysis
Earnings Before Interest, Taxes, Depreciation, and Amortization (EBITDA) is a critical metric for assessing operational performance. By running scenario analyses on EBITDA, you can understand how changes in revenue, operating expenses, or other factors may influence your company’s profitability.
4. Valuation Scenarios
Understanding the potential value of your company in different scenarios is paramount, especially for stakeholders and potential investors. This feature allows you to model different valuation scenarios, giving you a range of potential enterprise values.
The Power of Visual Representation
Charts are the unsung heroes of financial analysis. They transform raw data into visual stories, making complex information instantly comprehensible. In the Three-Statement Financial Model, these charts serve as your visual compass in the scenario analysis journey.
1. Cashflows Chart
This chart provides a visual representation of how cash flows may evolve in different scenarios. You can quickly identify cash flow patterns, allowing for strategic decisions regarding working capital management and investment allocation.
2. Revenue Chart
The revenue chart vividly illustrates how different scenarios may impact your top line. It enables you to visualize revenue trends and identify potential inflection points.
3. EBITDA Chart
This chart provides a clear snapshot of how variations in scenarios affect EBITDA. It’s a powerful tool for evaluating the operational efficiency and profitability of your business under different conditions.
4. Valuation/Enterprise Value Chart
For investors and stakeholders, understanding the potential value of the company is paramount. The Valuation/Enterprise Value Chart provides a visual representation of the range of potential valuations, aiding in strategic decision-making.
By leveraging Scenario Analysis and Charts in the Three-Statement Financial Model, you not only gain the ability to foresee potential outcomes but also the confidence to navigate through them. This feature is a strategic compass, helping you chart a course that leads to sustainable growth and profitability.
Seize the Future with Confidence
In the ever-evolving landscape of business, having a powerful ally by your side is not just an advantage; it’s a game-changer. The Three-Statement Financial Model is more than just a tool; it’s a blueprint for success. It empowers you to not only understand your business but to master it.
With this model, you’ll gain unparalleled insights into your company’s financial dynamics. You’ll make decisions with the precision of a surgeon, strategically optimizing resources and seizing opportunities. From setting realistic revenue targets to navigating potential challenges, this model is your unwavering partner in the journey to success.
Imagine the peace of mind that comes from knowing you have a dynamic, customizable tool that adapts to your unique business needs. From high-level executives seeking a concise overview to entrepreneurs forging new paths, this model is tailored for you. So, why wait? Take the reins of your financial destiny and unlock the potential of your business. Invest in the Three-Statement Financial Model today and stride confidently into the future. Don’t just meet the challenges; conquer them. The future is yours to shape.
About AUT Financial Modeling
Welcome to AUT Financial Modeling, your trusted partner for cutting-edge, comprehensive, and user-friendly financial models. With a strong focus on corporate finance, valuation, and private equity, we bring together expertise, innovation, and precision to deliver the highest standard of financial modeling solutions.
At AUT Financial Modeling, we understand that accurate and reliable financial models are the backbone of informed decision-making. We are committed to empowering our clients with the tools they need to navigate the complex world of finance.
Our team of seasoned professionals combines deep industry knowledge with advanced technical skills, enabling us to craft financial models that are tailored to the unique needs of your business. We take pride in our attention to detail, ensuring that every aspect of the model is meticulously crafted to reflect the intricacies of your specific situation.
Partner with us today and unlock the full potential of your financial analysis.
Feel free also to check out the full list of industry-specific templates by AUT Financial Modeling here:












You might also like:
- 10 Step Financial Planning Checklist for Smart Executives
- 10 Main Elements of a Business Plan
- How to Prepare a Financial Plan for a Chicken Egg Farm?
- Financial Projections Templates – The Easy Way
- Business Valuation
- How to Raise Series A Funding?
- Financial Planning for Small Business Owners – Taking an SBA Loan
- How to Build a Capitalization Table
- 5 Tips to Develop a First Class Business Valuation Report
- Financial Forecasting Models by eFinancialModels
- Business Consulting Services
- Scenario Analysis
- Personal Finance
- 10 Ideas to Increase Average Revenue Per User
- How to Calculate Net Present Value (NPV)?
- Real Estate Financial Modeling in Excel
- Three Statement Model | Three Financial Statements
- Financial Modeling for Startups and Small Businesses
- Top 5 Principles of Corporate Finance
- Top 10 Mistakes in DCF Valuation Models


