Two Basic Structures of Financial Models
Financial models are used to project the financial performance of a business or an asset over time. To learn more about financial modeling, we’ll show you the two ways to structure such models:
- Direct Cash Flow Model
- Three statement model
Direct Cash Flow Model
A Direct Cash Flow Model is a simple financial model which seeks typically to project the Direct cash flows of a business or an asset over the next years. What is required is to project the revenues, costs, and needed investments. This is considered the simplest way to do projections.
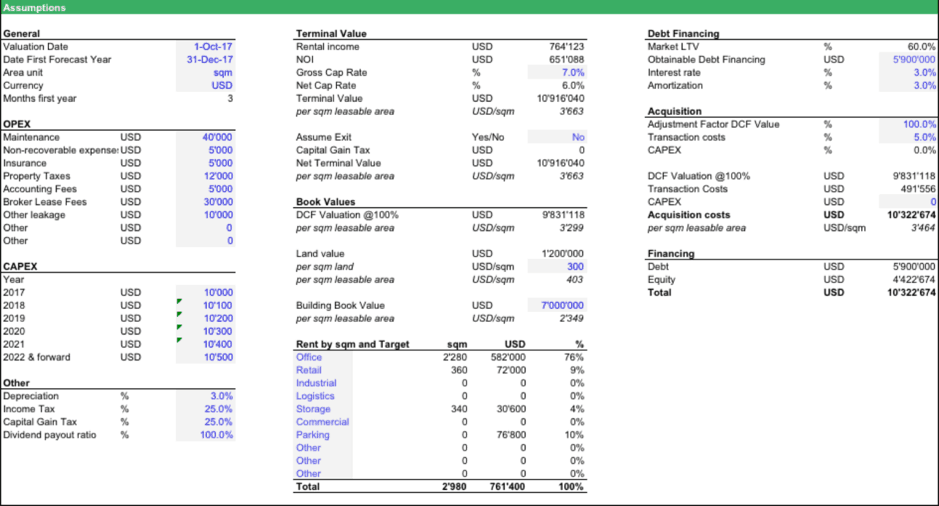
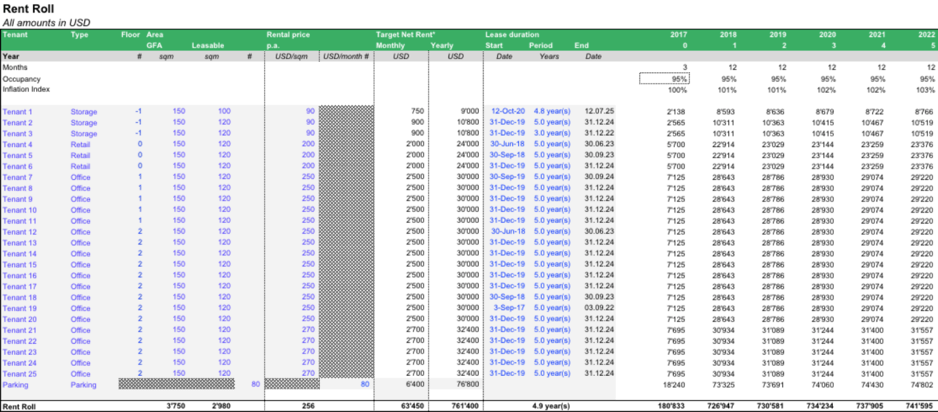
These projections usually use just a couple of lines in Excel. As an example, see the picture below which shows a commercial real estate valuation model using the first basic structure of a financial model.
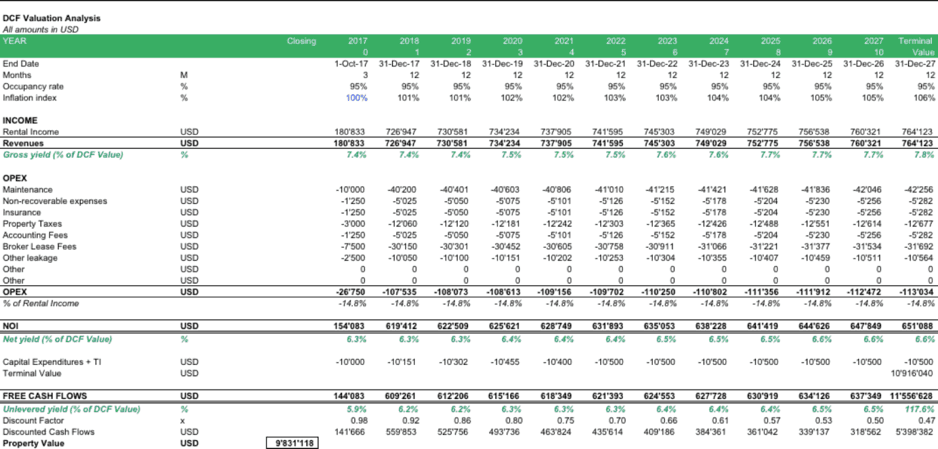
Where do these cash flows come from? – Basically, they come from the assumptions and from the rent roll projections. Because the model is elementary, the operating model is directly included in the direct cash flow projection.
Assumptions
Operating Model – Rent Roll
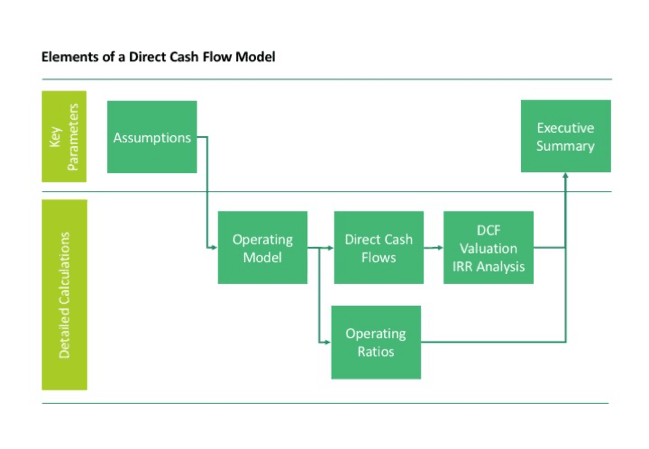
So the model structure is pretty simple and can also be applied to businesses or assets other than real estate. The model structure is as follows:
- Assumptions
- Operating model
- Operating ratios
- Direct cash flows
- DCF or IRR analysis
If financial modeling would always be that easy, then why do analysts prepare complicated spreadsheets in other cases? – The answer is because in other cases, e.g., valuing a business, there are more details needed, or the analysis needs to include many more important aspects. The financial model structure, therefore, depends on the purpose of the financial model and the type of questions it seeks to answer.
A simple financial model such as a direct cash flow model can therefore only provide limited answers to the following questions:
- How much cash flow an asset or business will generate?
- What is the corresponding net present value of those cash flows?
- What is the IRR?
In reality, it is a fact that doing business is more complicated. Especially in the case of businesses, revenues actually might not even be collected, as the invoices have not been paid. This would require projecting the receivables outstanding on the balance sheet (which normally is excluded if you don’t model a forecasted balance sheet correctly). People more familiar with accounting know that profits and cash flows are two different things as the timing of the payment also needs to be considered and especially for business valuation purposes, Cash is king!
To conclude, using a simple, direct cash flow model can be quite useful as it is quicker to do than a more complex model, as long as one is aware of the limitations of this approach. A more sophisticated way to prepare a financial model is a three statement model.
Three Statement Model
A more precise way to model a business or asset’s future financial performance is to model proper financial statements in the future together with more details on its derivations. The term three statement model refers to the income statement, balance sheet and cash flow statement, which together forms the three statements required to understand any business.
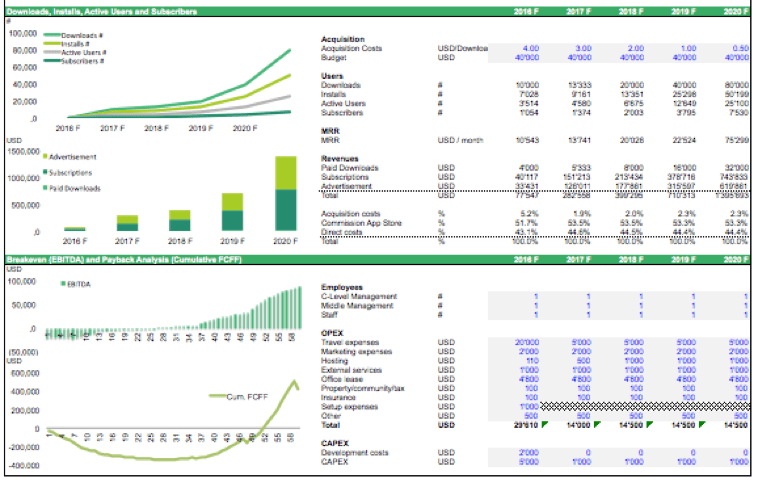
Below is an example of a three statement model using the financial model for a mobile app as a reference.
Three Statement Model: Income Statement, Balance Sheet, and Cash Flow Statement
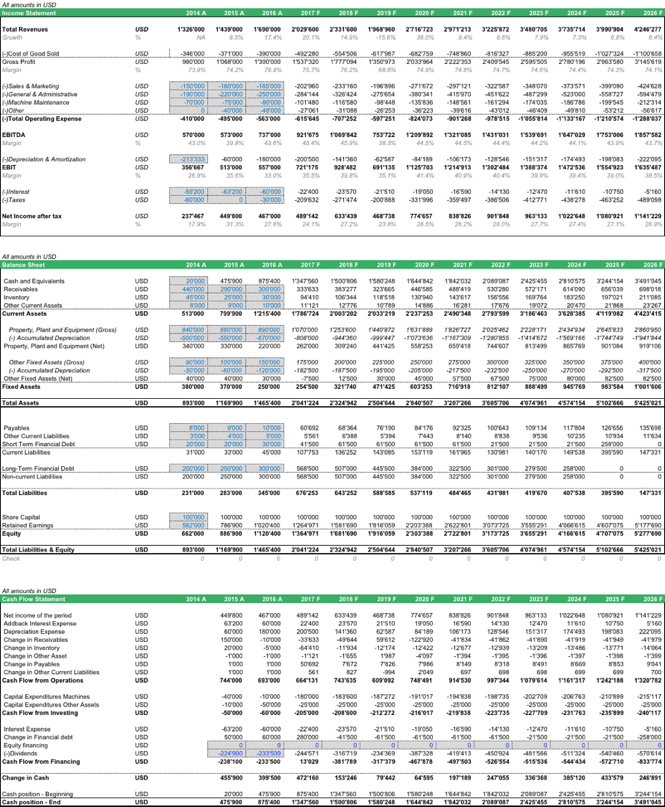
As you can see above, the core of the three statement model, form the financial statements. As this is a bit more complex to calculate, one needs to do some more pre-calculations beforehand. Thus, this means the model structure now becomes extended, normally as follows:
- Assumptions
- Operating model
- Operating ratios
- Fixed Asset Schedule
- Debt Schedule
- Financial statements (Income Statement, Balance Sheet, and Cash Flow Statement)
- Financial ratios
- DCF or IRR analysis
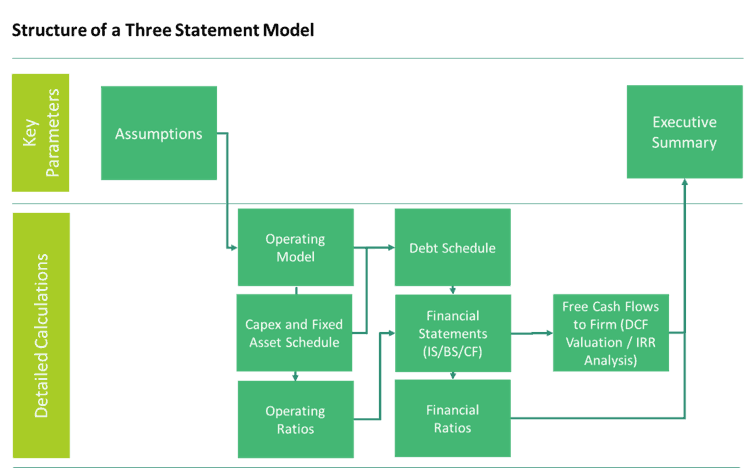
So, this means you will need to work through all these elements until your analysis becomes complete, which usually takes a bit more time than just making a simple, direct cash flow projection.
Let’s look now at each element of the structure in more detail to help you better understand.
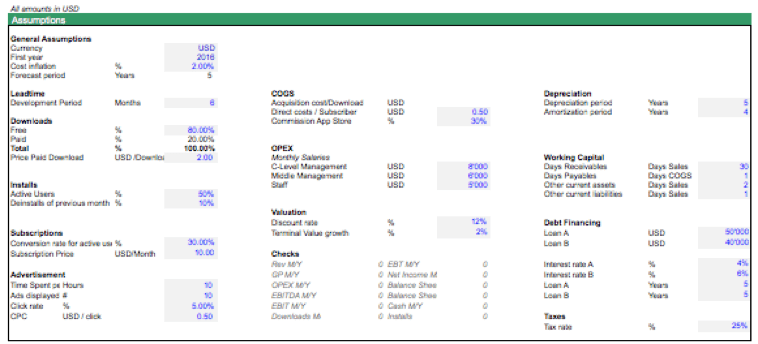
Assumptions
The assumptions, in this case, are stated in the Executive Summary. All assumptions are marked blue. There are assumptions in there to estimate revenues, costs, the timing of payments received and issued and assumptions concerning the investments in software development and fixed assets as well as taxes, depreciation and interest rates.
Operating Model
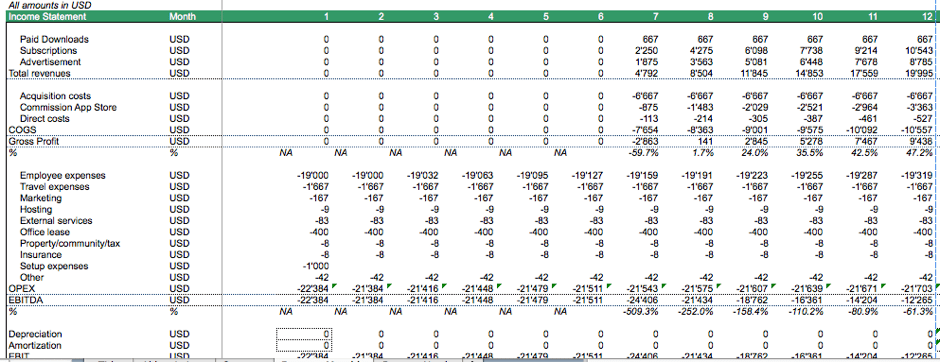
In this case, the operating model is more complicated. As shown, we have three different sources of revenues which are:
- Paid app downloads which depend on the marketing budget available to promote such
- Subscription revenues which depend on the conversion between free and paid users
- Advertisement income which depends on the time spent on the app
Accordingly, we need to model the number of downloads we can get, either free or a premium version which is summarized as income from paid downloads.

The next step then is to model the conversion from active users to subscribers. Assuming the conversion rate is 30%, the number of subscribers now depends on the number of users you can get to download this app.

For advertisement revenues, the model is similar; one just needs to estimate the time number of ads displayed during the time a user spends on the app and the click-through rate.

The last part of the operating model is to forecast the operating costs, which in this case can be modeled on a per month basis. Please note, some of the costs will be modeled as being fixed per month while other costs will be proportionate to other variables such as the number of users, subscribers, etc. The best is to work through these costs on a line per line basis.
Operating Ratios
The operating model will also lead to understanding important operating ratios, which in the case of an app, can be items such as a number of downloads, installs, active users, subscribers, and the monthly recurring revenue. The list is not exclusive and of course, can be adjusted as needed, depending on your specifications.

Fixed Asset Schedule
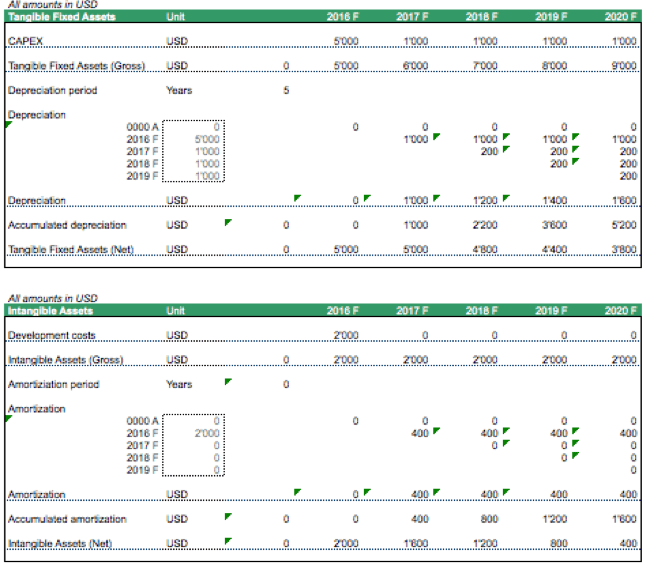
To build the balance sheet, one needs to project fixed assets which are a function of capital expenditures and depreciation. Apart from tangible assets, in the case of mobile app companies, there might also be software development costs which can be activated on the balance sheet and amortized. So, a Fixed Asset schedule should take care of this.
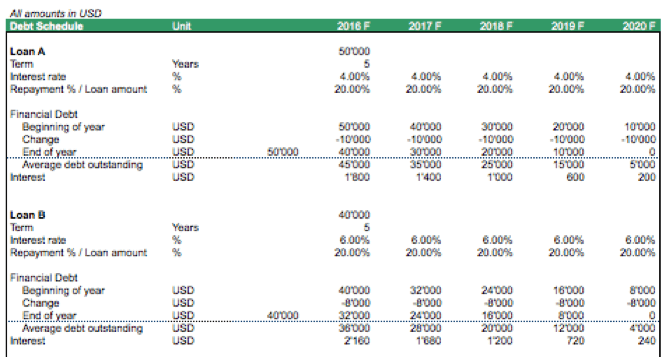
The balance sheet also needs to forecast the financial debt. Therefore, a debt schedule is needed. However, in the case of a mobile app, there might be no bankable assets, and third-party debt normally should be zero. Depending on what kind of business you’re running, the debt schedule could also be used to model shareholder loans.
In a financial model, financial statements are a crucial element to accomplish its objective. As you’ve seen from the example above for the financial statements which are the same as a three statement model. Financial statements consist of Income Statement, Balance Sheet, and Cash Flow Statement.
Financial ratios
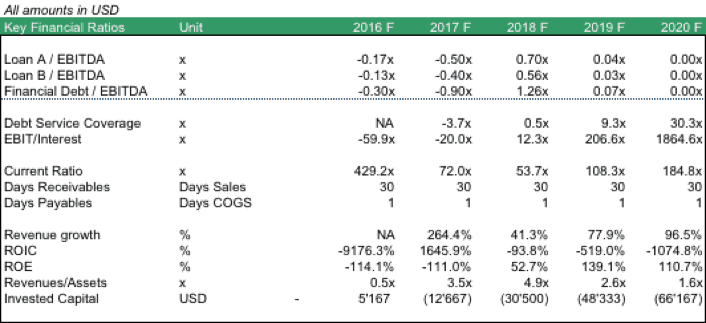
The next component of the model are the financial ratios, which can be very helpful to look at the business from a different perspective. Important ratios are
- Financial Debt /EBITDA which is a key ratio for any lender,
- The Current Ratio which indicates if your business has sufficient net working capital (should be bigger than 1, depending on industry minimum 1.5x or even 3.0x) or not.
- ROIC which indicates the profit made on all capital invested. This return measurement has to be higher than the discount rate used; otherwise, the alternative to investing the money somewhere else would appear to be better.
In this case, some ratios are less meaningful as this model is made for a mobile app Startup business where EBITDA is negative in the first years. This explains the negative Financial Debt/EBITDA ratios.
DCF or IRR analysis
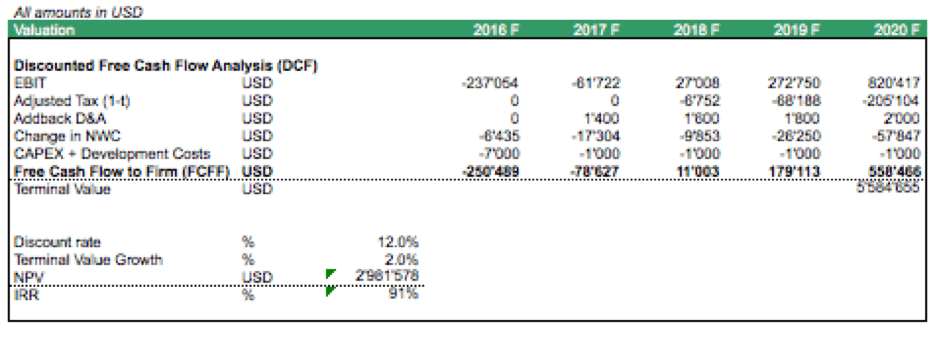
A DCF valuation normally bases on the concept of Free Cash Flow to Firm (FCFF). The cash flows are then discounted by the company’s discount rate to determine the net present value (NPV).
Free Cash Flows to Firm can also be used to calculate the project IRR.
Please note, these cash flows are the company’s cash flows and therefore different to the investment made and payment received by investors.
In Conclusion
Basically, both structures, Direct Cash Flow Model and Three Statement Model, are used widely depending on what you need for your business.
Direct Cash Flow Model is for simple financial models which satisfies the only needed elements in a financial model. While Three Statement Model is for financial models that need more details included, to complete the goal of the financial model.
You should also take note that Direct Cash Flow is different from what we know as DCF which stands for Discounted Cash Flow, a commonly used valuation method.
Now that you know about the two basic structures of financial models, if you look at financial models this modular way, they become easier to understand, and you can simply work through module by module to fine-tune your models as needed.
With our financial model templates, feel free to adjust the model’s component to fine-tune it to your specific business and let us know what you think by leaving a comment below.


