Financial Modeling in Excel – Significance, How To’s, and What to Avoid

In simpler terms, financial modeling in Excel is the task of building a financial model. A financial model is basically a tool most commonly build in Excel to conduct a projection of a business’ or an entity’s financial performance into the future. The projections are mostly based on the historical performance and assumptions that are realistic to result with as much as precision possible.
You may think that a financial model is simply an Excel spreadsheet, but you should already know that not every spreadsheet is a financial model. Excel is a very useful tool that allows any user to create spreadsheets for different kinds of purposes just like a financial model.
However, a financial model is:
- More structured. A financial model contains a set of variable assumptions — inputs, outputs, calculations, and scenarios.
- Is dynamic. A financial model contains inputs that, when changed, impact the calculations and, therefore, the results.
- Uses relationships between several variables. When the user changes any of the input assumptions, a chain reaction often occurs.
- Shows forecasts. Financial models are almost always looking into the future.
- Contains scenarios (hypothetical outcomes). Because a model is looking forward instead of backward, a well-built financial model can be easily used to perform scenario and sensitivity analysis.
In short, a financial model in Excel is a much more complex spreadsheet which has a unique structure, contains inputs, outputs, and is flexible and dynamic. Creating a financial model will require skills and the know-how, therefore, if you need a financial model, you can either hire a financial modeling expert to help you or you can start learning now on how to build a financial model in Excel.
Before we discuss further on how to build a financial model in Excel, let us review first on the significance of financial modeling in Excel.
Significance of Financial Modeling in Excel

There are many kinds of users that build and use financial models for different purposes and goals. Usually, financial modeling in Excel solves real-world financial problems or act as a tool to guide the user to arrive at a good financial decision. May it be entrepreneurs, business owners, consultants, CEOs, or CFOs, are known as big users of financial models.
As you already know, a financial model is designed to represent a financial situation in numbers in order to help the user make better financial decisions. As such, wherever there are financial problems or situations that needed solving, analyzing, or translating into a numerical report, building a financial model makes a whole lot of difference.
Though the logic behind the financial model is based on an idea or a concept that still needs to be converted into a business case or feasibility proposal, by simply making use of the results of the financial model, you can put substance of the idea by augmenting the details enough to get a working model upon which financial decisions can be made as well as help you convince investors to help with funding.
As to why Excel is the most commonly used program to build a financial model spreadsheet, it is mainly because Microsoft Excel and financial modeling go hand in hand. Not only does Excel is one of the most known tools for building a spreadsheet, but it is also because of the many features, functions, and formulas that it has to offer for building financial models.
There are, of course, other spreadsheet programs that you can use to build a financial model, however, we recommend using MS Excel due to its flexibility and the ability of transparency it can offer to any kind of user.
How to Build a Financial Model in Excel

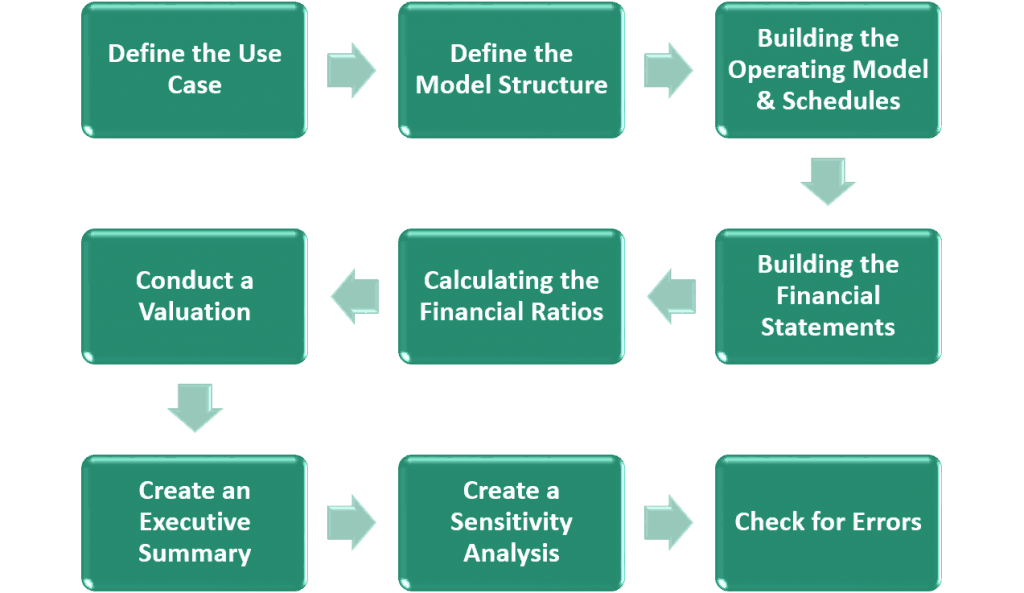
Financial modeling in Excel can be very complex depending on the purpose of the model especially if there are many aspects to consider in order to create a model that works and realistic. You will need to work through the process of building a financial model step-by-step such as the following:
- Define the Use Case of the Model.
- Financial Planning
- Capital Raising
- Mergers & Acquisition
- Financial Feasibility Analysis
- Project Finance
- Valuation
- Tracking
- Etc.
- Define the Financial Model Structure suitable according to your use case.
- Direct Cash Flow Model – simple and direct financial model which tracks all cash flows
- Three Statement Model – most commonly used financial model structure to show the forecasted financial statements such as Income Statement, Balance Sheet, and Cash Flow Statements.
- Building the Operating Model, Fixed Asset Schedule, and Debt Repayment Schedule.
- Separate the inputs from the outputs to easily determine the results from the assumptions.
- Build the Fixed Asset and Debt Repayment Schedule as needed.
- Break down Revenues, Costs, and CAPEX to their key drivers.
- Building the Financial Statements and Financial Ratios.
- Take the figures from the operating model accordingly to the financial statements.
- Calculate financial ratios.
- Cross-check if your forecast looks realistic and if it adds up.
- Conduct a Valuation. Usually, build a DCF Valuation.
- Calculate the discount rate (WACC or also known as the Weighted Average Cost of Capital).
- Forecast the Free Cash Flows to Firm.
- Calculate the Terminal Value and Net Present Value.
- To save some time, download a DCF Model Template here: DCF Model.
- Create an Executive Summary.
- This will serve as a summary of all the key figures of the model.
- Create a Sensitivity Analysis.
- Build sensitivity tables and check that each parameter used in the tables flows correctly through the entire model.
- Usually, this is built after creating an Executive Summary to easily go through the worst and best-case scenarios for the input parameters and directly see the results in the Executive Summary.
- Check for Errors and Inconsistencies throughout the model.
What to Avoid when Building a Financial Model in Excel
Building a financial model is not an easy task. That is why, most often, you would need the help of a financial modeler or invest a lot of time to ensure that the model works as it should. However, there are countless things that can go wrong when building a financial model but not all can afford to hire an expert or expend a lot of time.
In here, we listed some of the most common mistakes that one can encounter and answered how to avoid such cases if possible. After all, it is best to be aware of these potential problems so that you can avoid them in the future.
- Numbers don’t Add Up. Confidence in the numbers comes from an intimate understanding of the process and calculations that make up the model. You need to be absolutely sure of any numbers you’re presenting, and you need to be able to explain exactly how you came up with the results. Therefore, in case this happens, just conduct another thorough test of the model and make use of Excel’s error checking feature.
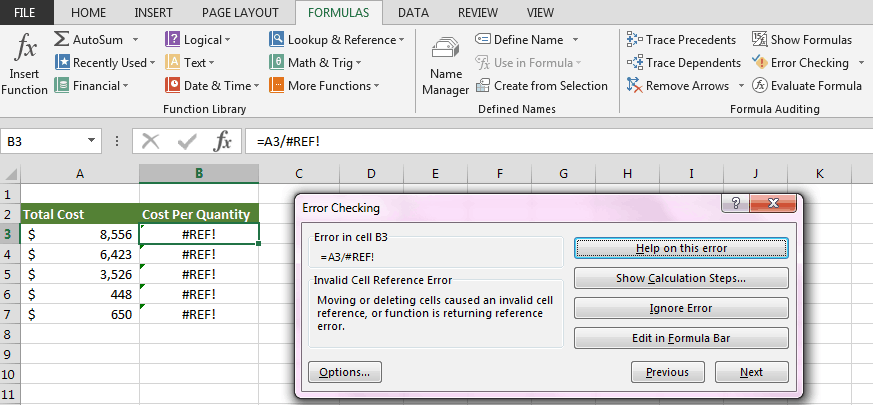
- #REF! Errors showing up. This error usually means that the cell(s) the formula is referring to have been deleted or that the formula is referencing off the sheet. These errors are the most difficult to fix because the offending cell is no longer there, so the entire formula needs to be rebuilt. To fix this type of error, you need to go back to the beginning, assess what the formula was trying to do, and rebuild it from the ground up. Here is what a #REF! error looks like:

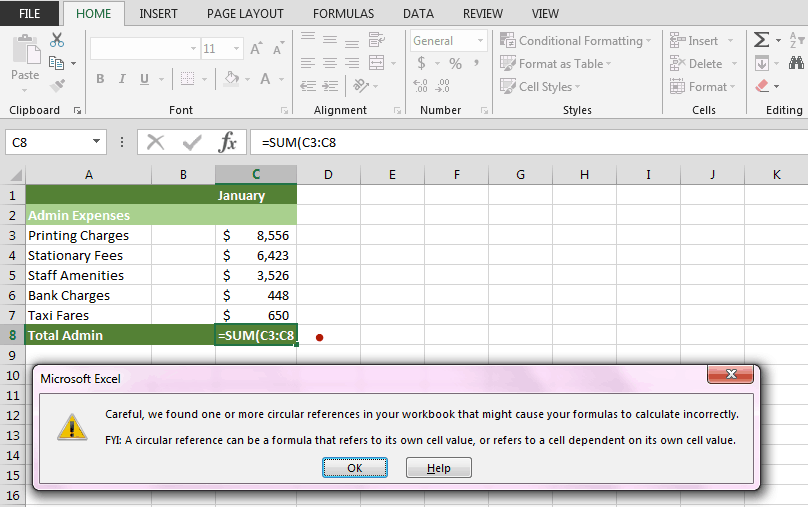
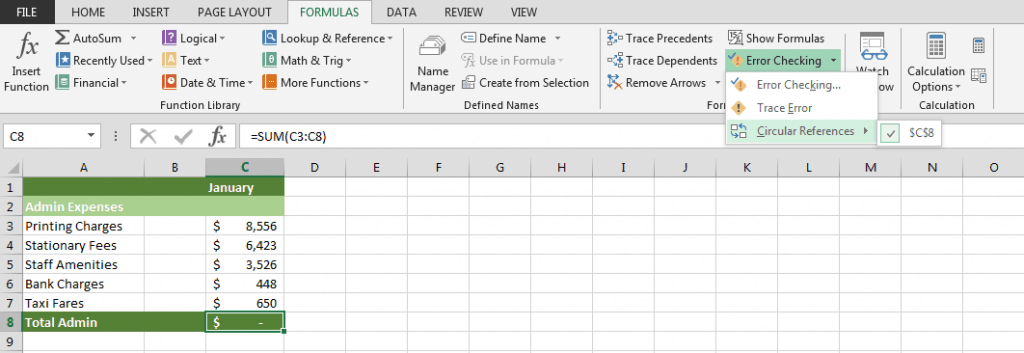
- Circular References. This is the result of a formula that somehow links back to itself. The most common circular reference is when you accidentally include a cell’s reference in its own formula. The best way to avoid circular references is to simply undo what you just did as soon as the circular reference warning appears. Or you can make use the feature in Excel by clicking the Formula tab on the Ribbon (error mark within the cell), and find the Formula Auditing section. Then, from the Error Checking drop-down box, select Circular References. Here is a sample illustration of a Circular Reference:


- Too much detail. There’s nothing wrong if you want to be thorough with your model and it is, of course, an important attribute for a successful financial modeler to have. However, it’s easy to lose yourself in detail and get completely bogged down by it. Putting too much detail in a model creates a false impression that you know more than you really do. The model is just an estimate of what you think might happen. Therefore, it is best to stick to what is needed of the user of the model. Simplicity is key after all.
- Complicated Formulas and Formula Link References. Keeping the formulas as simple, clear, and straightforward as possible is always a good practice. Remember that the model isn’t only for you to use — it should be a tool that anyone in your team can pick up and understand with a minimal explanation from you. As you’re building a model, take a moment to consider the user who needs to make sense of your formulas afterward. And since the financial model is in Excel, there is full transparency of every formula used and links.
The above are just the most common problems that you can encounter when building a financial model in Excel. If you want to learn in more detail about financial modeling in Excel, you can also check out this article: How to Build a Financial Model.

