The Significance of a Financial Analysis Excel Template

What is Financial Analysis?
Financial analysis is defined as an assessment of the viability, stability, and profitability of a business, sub-business or a project (Source: Wikipedia). Financial analysis is used by decision-makers to assess the economic and financial situation of business, projects, budgets, and other finance-related entities. Financial analysis mostly relies on analyzing and interpreting a variety of financial ratios that make use of information taken from the company’s financial statements. Basically, financial analysis is the study of the relationships among the numbers in the financial statements to help users identify the strengths and weaknesses of a business. This is why some would also refer to financial analysis as financial statement analysis.
The Basis: Financial Statements
Financial analysis based on the analysis of the company’s financial statements as per the yearly period end or interim accounts. These statements are the record or report of all the financial activities and standing of a business or entity. It is created in a structured and managed manner which will make it easy to understand.
There are 3 main financial statements.
Income Statement
Also known as a statement of comprehensive income, statement of revenue and expense, P&L or profit and loss report. This showcases the record of a company’s income, expenses, profits or loss over a period of time as well as represents the underlying profitability of a company. Of all the financial statements, the income statement is the simplest to understand because it simply shows the revenue earned by the business as well as the operating costs expended related to generating the said revenue.
Another thing that differentiates the income statement from the other financial statements is that each column refers to only one period. Most income statements are built on a monthly basis; some are also annual. With a cash flow or a balance sheet, you need to carry over the amount from the previous period, but with an income statement, each period starts fresh.
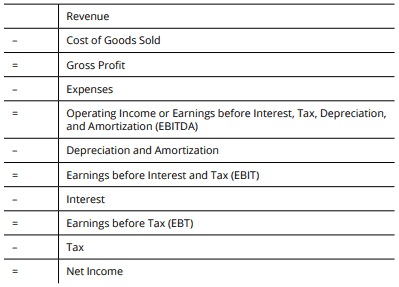
It can also be used as a tool to compare the current performance, tracking the performance, and providing data to use as a basis to create a forecast or budget. To build a financial model, it is a must to know how to create an income statement and its common format. Below is the format of how an income statement is usually built.

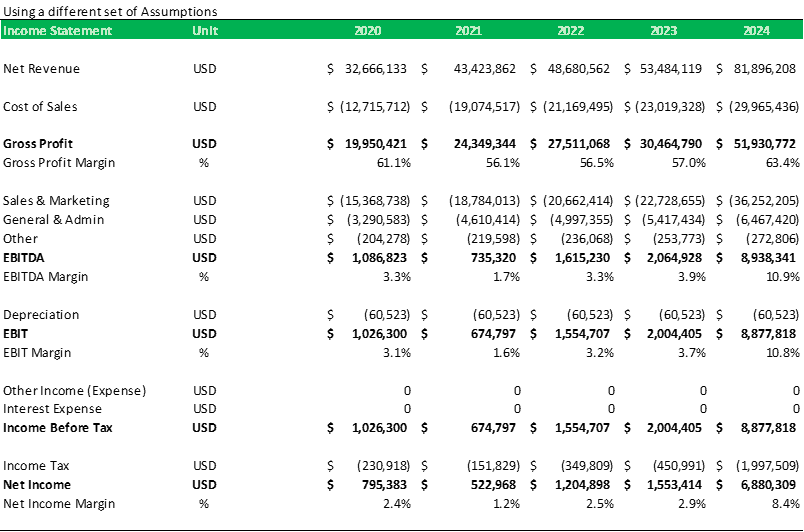
In a financial model, the income statement’s component is used for ratio analysis such as calculating the profit margin or also known as return on sales or gross profit ratio. Such ratios are good indicators of the business’ standing or position. The profit margin is one of the many ratios that investors and creditors use to check the financial health of a company. Dividends and returns are paid from profit, so if an investor buys shares in the company, he/she would like to know how likely it is to receive dividends. Banks or other creditors use the profit margin to see whether they’re likely to get their money back. Below is an example Income Statement in a financial model.

Cash Flow Statement
As straightforward as its name implies, it reports on all the cash flow activities, especially its operating, investing and financing activities. It is used to understand the movements of cash and especially where the cash has been used or generated. By simply building a cash flow statement, it can help with planning your business’ cash flow such as identifying and eliminating shortfalls or overflow in cash projections.
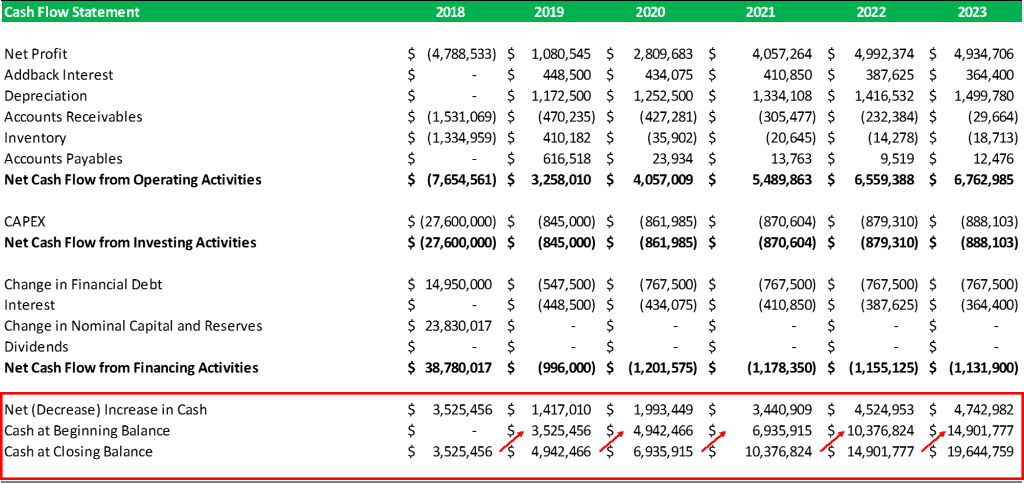
To model the cash flow, start with the opening cash balance, add income, and deduct outflows from payments. This will give you an idea of whether you have a surplus or a deficit for that period. If financing is needed, you’ll add that as an amount coming into the bank account, and then calculate any repayments or interest payable going forward. The closing balance of one period becomes the opening balance of the next period, like a corkscrew cash flow modeling, as shown below.

You can also refer below of what the cash flow statement looks like in a financial model while showing the closing balance used as the starting balance for the next year:

Additional sources of information can be the footnotes provided in the appendix to such financial statements or management accounts as to further solidify the report.
Balance Sheet
Also known as a statement of financial position, showcases the company’s assets, liabilities and owner’s equity at a given point in time. The accounting equation as shown on the balance sheet is perhaps the single most important concept to understand in terms of financial statements modeling: Assets = Liabilities + Shareholders’ Equity.
The balance sheet shows the financial position of a company at any given moment. Just as with the income statement, the elements of a balance sheet need to be arranged in a specific order:

As shown above, the assets, liabilities, and shareholder’s equity are comprised of several accounts that represent the specifics of a company’s finances. But depending on the nature of the business as well as the industry, it will vary and will have more components such as different kinds of stocks, tangible and intangible assets, payables, taxes, etc.
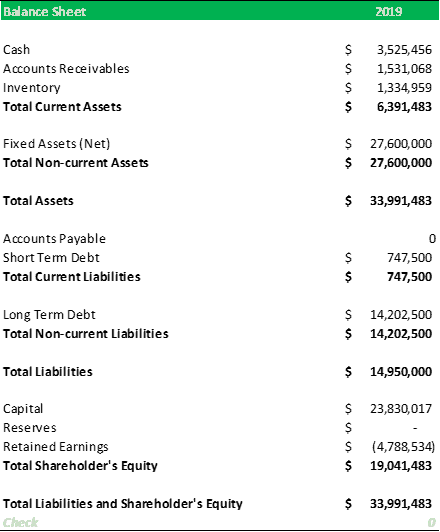
Below is an example illustration of a simple balance sheet using the standard accounting form:

At the bottom part, you will see a balance sheet checker. It is the most important part to add since it is commonplace where some error will surface especially for balance sheets with more components added. It will be very helpful for the user to fix why the accounts do not balance.
Conducting Financial Analysis is to better understand the financial statements by investigating the company’s financial situation around the following topics:
- Liquidity – positive cash flow for immediate obligations [cash flow statement]
- Profitability – yield capability in both short and long term [income statement]
- Solvency – debt payment capability to creditors and third parties in the long term [balance sheet]
- Stability – remain in business in the long run without losses [all financial statements]
Important Financial Ratios used in Financial Analysis
Below we provided some of the most relevant financial ratios which can be used to analyze nearly any business as well as their corresponding formula to calculate such ratios.
Liquidity analysis
- Current Ratio – Also known as the working capital ratio, is used to measure a company’s repayment ability in short-term and long-term debts. Basically, this ratio is used to ensure if the company is capable of paying its liabilities both short-term and long-term. To better understand how the current ratio is calculated, use the formula: Current Ratio = Current Assets / Current Liabilities
- Quick Ratio – Also known as the acid-test ratio, is used to measure a company’s ability to pay its short-term debts using its most liquid assets. This ratio focuses more to measure if the company is capable of paying its liabilities in a short-term using liquid assets, which means inventories are excluded from the current assets. The formula to calculate the quick ratio is: Quick Ratio = (Cash + Marketable Securities + Accounts Receivable) / Current Liabilities
- Cash Ratio – This ratio is used to measure a company’s ability to pay its short-term liabilities using only cash and cash equivalents on hand. Testing a company’s ability whether it can handle paying the full brunt amount of all current debts immediately without having to resort to liquidating any assets. The formula to derive the cash ratio is: Cash Ratio = (Cash + Cash Equivalents) / Total Current Liabilities
- Days in Receivable – Commonly known as Days Sales Outstanding (DSO), is used to calculate the estimation of a company’s average collection period. Basically, this will represent a company’s management condition of their accounts receivables. The formula to calculate DSO is: Days in Receivable = (Accounts Receivable / Annual Sales) * 365 days
- Days in Inventory – Commonly known as Days’ Sales in Inventory (DSI), is used to measure the average number of days a company was able to sell the average number of inventories they held during that time period of a year. Basically, this will serve as proof of a company’s ability to turn its inventory into sales. The formula to calculate DSI is: Days Sales of Inventory = (Inventory / Cost of Sales) x 365 days
- Days in Payable – Commonly known as Days Payable Outstanding (DPO), is used to measure a company’s ability to pay its invoices or bills to its suppliers, vendors or creditors. The ratio derived from this will be the company’s average payable period, depicting a company’s proper management of its cash flows in a given number of days to pay off its account payables. To calculate the DPO, this formula is used: Days Payable Outstanding = (Ending Accounts Payable / Cost of Sales) * Number of Days
Leverage Analysis
- Debt / EBITDA – refers to the relationship between Debt to Earnings before Interest Depreciation and Amortization. A ratio leverage measurement to calculate how long it would take for a company to pay back its debt if its Debt/ EBITDA is held constant. This is the formula to calculate this ratio: Debt / EBITDA Ratio = Debt / EBITDA
- Interest Coverage Ratio. It is a ratio to measure a company’s credit-worth both by rating agencies and in debt-financed takeovers. Basically, this is to ensure that the company can pay their interest expenses on its outstanding debt by comparing how many times EBIT is covering the interest expenses. The formula to calculate this ratio is as simple as how it looks: Interest Coverage Ratio = EBIT / Interest Expense
- Debt to Equity – This ratio is used to assess the company’s debt to finance its assets relative to the value of the shareholders’ equity. Basically, this ratio will help measure a company’s debt relative to the total value of its stock. To calculate the D/E ratio, this is the formula: Debt / Equity Ratio = Total Liabilities / Shareholder’s Equity
- Debt to Total Assets – This ratio is used to assess the total percentage of all assets that were financed by creditors, liabilities, or debt. This is actually a broad ratio since it includes short-term and long-term debts, as well as both tangible and intangible assets. Hence, analysts often prefer using Debt to Equity instead of Debt to total assets. To calculate, use the following formula:
Total Debt to Total Assets Ratio = (Short-Term Debt + Long-Term Debt) / Total Assets
Efficiency Analysis
- Total Assets Turnover – This ratio is simply used to measure a company’s ability to yield sales from its assets by comparing net sales with the average total assets. As simple as its definition, the formula to calculate this ratio is the following: Asset Turnover Ratio = Net Sales / Average Total Assets
- Fixed Assets Turnover – This is the ratio of sales referred from the Profit and Loss Account to the value of Fixed Assets in the Balance Sheet. Basically, this ratio is used to measure a company’s ability to generate sales from its fixed assets. The formula is the following: Fixed Asset Turnover = Net Sales / Average net Fixed Assets
Return Analysis
- ROCE – Return on Capital Employed, a ratio which assesses a company’s ability to earn a return on all the capital it employs. Helping investors see through growth forecasts and able to determine how reliable the performance of a company without including the effect of debt financing. This ratio is also used to measure for comparable companies relative profitability and compares the Net Operating Profit Less Adjusted Taxes (NOPLAT) to the Capital Employed (or Invested Capital). To calculate this ratio, the following formula is used: ROCE = NOPLAT/ Capital Employed
- ROA – Return on Assets ratio or sometimes referred to as return on investment, is used to assess a company’s ability to earn profit relative to its overall resources. Determining if a company is profitable due to its assets yield. To calculate this ratio, the following formula is used: ROA = (Net Income + Interest Expenses) / Total Assets
- ROE – Return on Equity or also known as return on net worth, is used to measure a company’s profitability by assessing the company’s ability to generate sales using the funding given by investors or shareholders. Basically, it is the net income returned as a ratio of the shareholder’s equity. This can be calculated by using the following formula: ROE = Net Income / Shareholder’s Equity
Financial Analysis Excel Template
Aside from fundamental analysis, there are many factors that affect the accuracy of the analyzations of the financial data, especially when using the financial ratios comparisons. Hence, depending on how you conducted your financial analysis and on what basis you’re following, the results will still vary.
The task of conducting financial analysis can be done by building a financial model, but not everyone is an expert when it comes to financial modeling. Good thing that downloading a Financial Analysis Excel Template is easy. Simply by going to a financial modeling platform, offering you choices from different business in different industries, to use these Excel templates as your base on where and how to start your financial analysis.
Providing you automatic calculations and definitions of the relevant financial ratios. The financial analysis excel template is also linked to the income statement, Balance Sheet, Cash Flow Statement, and all ratios are dynamically updated. Ensuring you to stay focus on what is relevant for your business model and what not, making it easy and helping you save more of your time.
If you’re interested and in need of a financial analysis excel template, you can try this sample financial analysis report template: Financial Modeling Analysis. This sample financial analysis report template is very simple to use and will help you keep track of the financial performance as well as evaluate the future trends. Feel free to check our website too which offers a wide range of industry-specific financial model templates in Excel made by skilled and experienced financial modeling experts.
These templates are used by different users such as executives, entrepreneurs, CFO’s, accountants, analysts, finance-related professionals, etc. from different countries such as USA, UK, Canada, Australia, Japan, and many more who are in need of help with their financial modeling tasks.

