
0 ITEMS

IRR vs NPV in the Context of Financial Decision-Making

Financial decision-making is crucial for business growth and sustainability, especially when managing large sums of capital.
- Capital allocation decisions impact long-term financial performance and require solid analysis tools like NPV and IRR.
- NPV forecasts the expected value of an investment by discounting future cash flows, helping determine if a project adds value.
- IRR measures the expected return of a project by finding the discount rate that makes the NPV zero, providing a quick profitability check.
- Comparing NPV and IRR offers different perspectives; NPV focuses on dollar value, while IRR highlights percentage returns.
- Understanding both methods enhances decision-making for investments, acquisitions, and project evaluations.
Continue reading to grasp how these financial metrics guide smarter capital allocation decisions.
Net Present Value (NPV) Analysis tells you the Expected Value
Net present value analysis – or also referred to as Discounted Cash Flow (DCF) analysis – forecasts the expected free cash flows of an investment project or a company and discounts them to their present values. For this, a discount rate needs to be used. The discount rate should reflect the opportunity cost of capital and the risk involved.
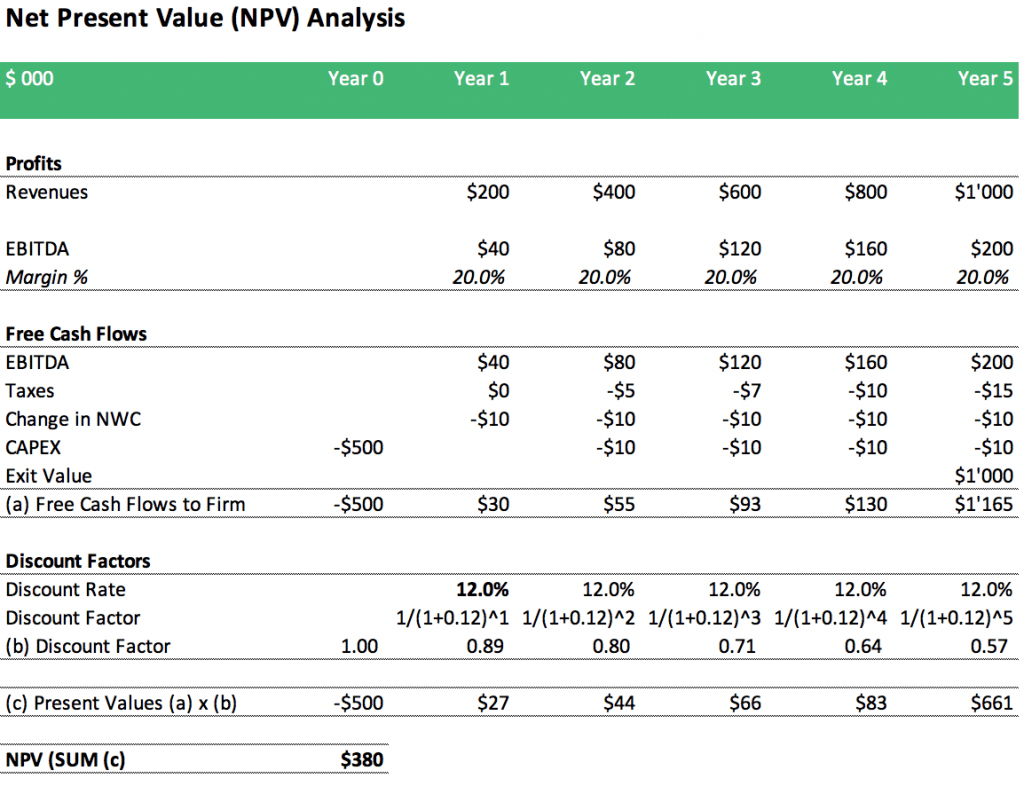
We can consider the example of an investment project, where you will invest $500’000 to acquire a new business, expand it and then sell it again after 5 years. What you can see in the illustrative example below is that that in the first year there is an investment cost of $500’000 while over the next years, profits are steadily increasing until the company will be sold in year 5. What you also can see is that the biggest cash flow occurs in year 5 (due to the exit proceeds) but its present value is significantly lower, the discount factor after 5 years is only 0.57. The reason for this low discount factor is, the investor will have to bear 5 years of risk and therefore foregoes 5 years of the opportunity to invest his funds somewhere else and get a return similar to the discount rate. When summing up all the discounted cash flows, using a discount rate of 12% in the analysis leads to a positive NPV of $380’000.
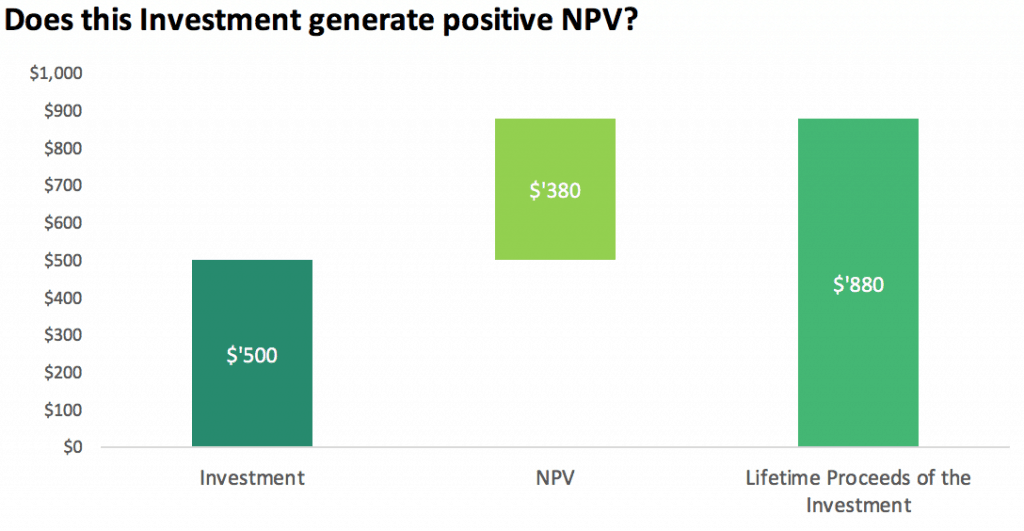
In terms of decision-making, when making an investment decision, the main question is: Does the project generate positive NPV? Or in other words, does the discounted lifetime proceeds (in terms of cash flows) exceed the required investment so that a positive NPV and value can be created. The answer is yes, the above investment generates positive NPV. Below graphic illustrates this comparison.
Positive NPV Check
The advantages and disadvantages of the NPV analysis are important to understand before relying on the result of this method for financial decision-making. NPV offers insights to quantify a project’s expected value creation capability in an absolute $ number.
Advantages of NPV
- Calculates the inherent value of a specific
financial plan based on expected future cash flows - Is not impacted by valuation multiples paid on
the stock market or paid via other transactions. Instead focuses on a specific business
case and its inherent value. - Takes into account the time value of money. Cash
flows today have more value than the same cash flows received 5 years down the
road. - Bases on free cash flows and net profit (which
can be manipulated) - The analysis is not affected if cash flows
change from positive to negative and vice versa over the lifetime of the
project - Determines whether the project will increase the
value of the company and by how much. - Does not have to deal with reinvestment
considerations - Performance improvements can be measured by
their impact on NPV - A good NPV financial model allows to simulate
changes in important assumptions and to determine the impact on the sensitivity
analysis
Disadvantages of NPV
- A
financial plan is a subjective estimate of the future and can be biased - Requires
a reliable financial plan as a basis for the analysis. - The
outcome is highly sensitive to important assumptions such as the discount rate
and exit value - The
NPV concept can be difficult to understand and explain - Investors
do not care about the expected value and instead want to know what is their
expected return
Use Cases
The NPV analysis is mostly used in the following situations:
- DCF Valuation of a company or property
- Price and value comparisons including the value
generated from synergies - Shareholder value concepts which require to
quantify the value created for shareholders - Whenever IRR analysis is not possible, e.g. due
to changing cash flow patterns.
Internal Rate of Return Analysis tells you the expected Return
IRR is very much related to NPV analysis (it is like a brother to NPV) as it bases on the same concept of Free Cash Flows. Important here is the definition of the Internal Rate of return (IRR):
“The Internal Rate of Return” is the discount rate which makes the NPV equal to zero.
So all we need to do is solve our NPV calculation above by inserting the discount rate which makes the NPV equal to zero. The result in the above example is that by using a discount rate of 27.3% the project’s NPV becomes zero. Ergo the IRR is 27.3%.
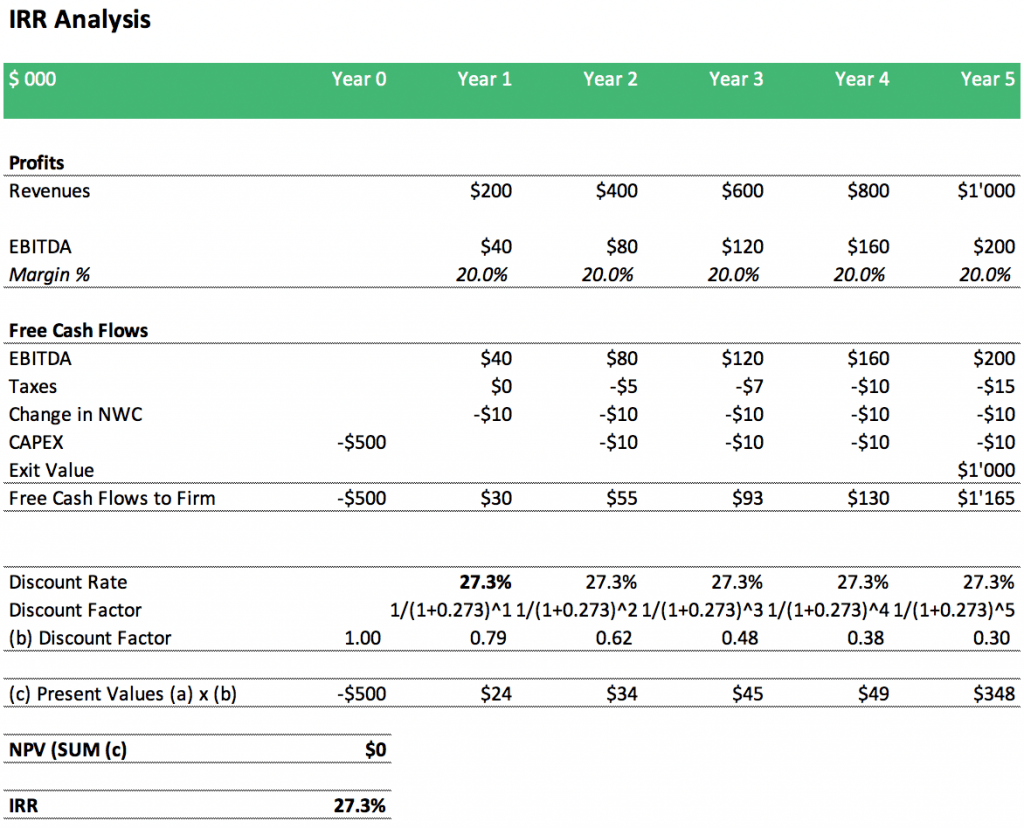
Please note, the discount rate of 27.3% here was purely determined by an iterative trial and error approach until NPV reaches zero. In Excel, this can either be done via the goal seek function or by using the IRR formula and apply it to the row of projected Free Cash Flows to Firm.
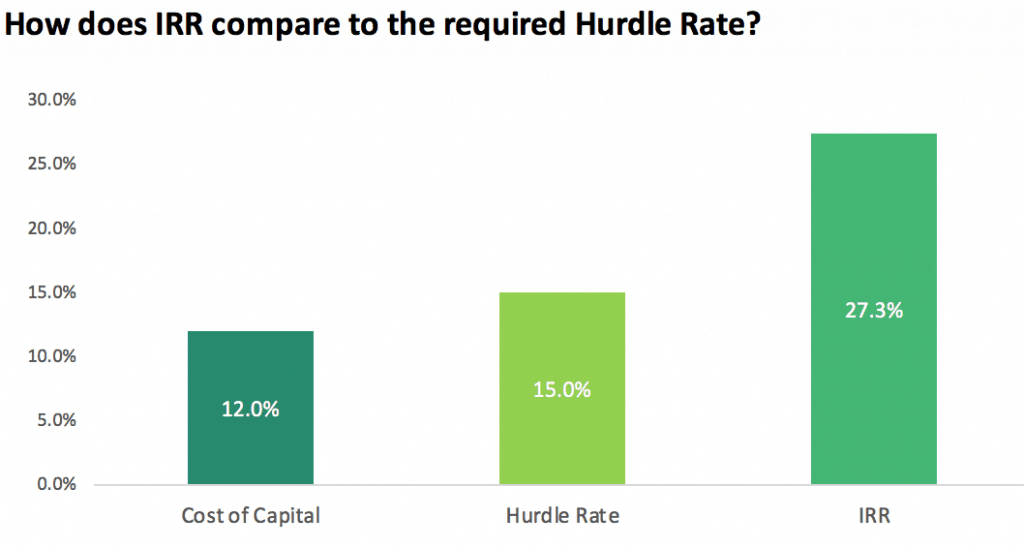
How shall we now read the IRR analysis? – What we need to do is to compare the IRR to the hurdle rate. The hurdle rate is a return target set either by the investor or the management and should reflect the target return the company is seeking. The minimum hurdle rate should be the cost of capital (the discount rate of the NPV analysis above) but in reality, investors and managers will have their own return preferences and might set the hurdle rate above the discount rate when they have lots of projects to choose from and can afford only to pursue the best ones.
IRR vs. Hurdle Rate
Also here, the quality of any conclusion derived from IRR analysis depends on a solid understanding of the merits and limitations of the IRR method.
Advantages of IRR analysis
- Accounts for the time value of money
- Basis on cash flow and net profit (which can be
manipulated) - Discount rate does not impact the calculated IRR
result - IRR can be easily compared to the discount rate
or alternative return possibilities on the market - The result can be easily understood by
non-finance people as they will compare the IRR to their other investment
alternatives
Disadvantages of IRR analysis
- IRR
analysis basis on a specific financial plan which is a subjective estimate of
the future and can be biased - Assumes the reinvestment of the positive future
cash flows for the remaining time period of the project is at IRR. This is not
practical since having the same investment opportunity is nearly impossible. - Ignores the economies of scale or the actual
dollar value of benefits. IRR analysis can make a small project look more
attractive and ignores the absolute $ benefit of a larger project - Not suitable for projects with a mixture of
multiple positive and negative cash flows as results mathematically can be
inconclusive.
Use Cases
The IRR analysis is mostly used in the following situations:
- Investment return analysis (e.g. buying a new
property, factory, etc.) - Calculation of investor return metrics (levered
cash flows or cash in / cash out calculations as the basis) - Project evaluations in Private Equity situations
with clear exit intent - Project finance calculations which use Project
IRR (based on Free Cash Flows to Firm) as the basis for their calculation
In practice, IRR analysis is widely used by investors despite its disadvantages. This means the main advantages – % return figure and easy to explain – outweigh its disadvantages.
The bottom line… IRR vs NPV when making financial decisions
NPV and IRR can both be used in the evaluation process when making important investment decisions. Here are the key takeaways:
Both methods:
- Use cash flow as the basis for their performance
measurements - Use financial plans based on subjective
assumptions - Consider the time value of money
- Can easily be combined as one can take the same
cash flows and calculate either the NPV or the IRR - Offer a clear framework for decision-making (for
NPV, the project is a go if the NPV is positive, for IRR the project should be
pursued if the IRR lies above its hurdle rate)
The outcome of any metric (NPV or IRR) is subject to the quality of those assumptions and the financial plan and the results can be quite sensitive to any changes in its assumptions.
However,
- NPV method presents a dollar return of the
project while IRR returns a relative % return - IRR analysis, therefore, does not capture the $
impact of a larger project - NPV analysis is mostly used for valuation
purposes while IRR is focused on investment cases and return calculations - In practice, IRR is also used for investor
specific cash flows (cash in / cash out considerations, levered cash flows)
while NPV mostly uses the project’s cash flows without considering the
financing structure - IRR analysis only works if the cash flow pattern
shows an upfront investment (negative cash flows) and positive cash flows
afterward. In case there is another year of negative cash flow, IRR analysis
can become inconclusive as mathematically it can lead to multiple results - IRR analysis makes an inherent assumption that
all cash flows extracted from the project can be reinvested at the same rate
(=IRR). In practice, this is nearly never the case as alternative projects show
different IRRs or projects require some preparation before they can be started - Changes in the discount rate only affect the
result of the NPV calculation but not the result of the IRR analysis (However,
the conclusion of the IRR analysis might be impacted as IRR is compared to the
discount rate) - For Buy & Hold Strategies, IRR is impacted
by the holding period as more funds rely on reinvestment than for shorter
duration projects. In those cases, NPV, but also alternative financial metrics
such as cash on cash yields, might be better financial performance metrics. - IRR analysis is more used for projects which
have a clear exit event rather than buy & hold strategies. - Try yourself to explain NPV analysis in simple
words to a small business owner who does not have any understanding of finance.
For him, it will be very difficult to grasp the concept of NPV. It will be much
easier to explain the IRR concept as here simply the result can be compared to the
stockmarket return. The small business owner will better understand how
attractive the investment is as he can compare the IRR to alternatives he might
be more familiar with.
IRR vs NPV Analysis in the Context of Financial Decision-Making
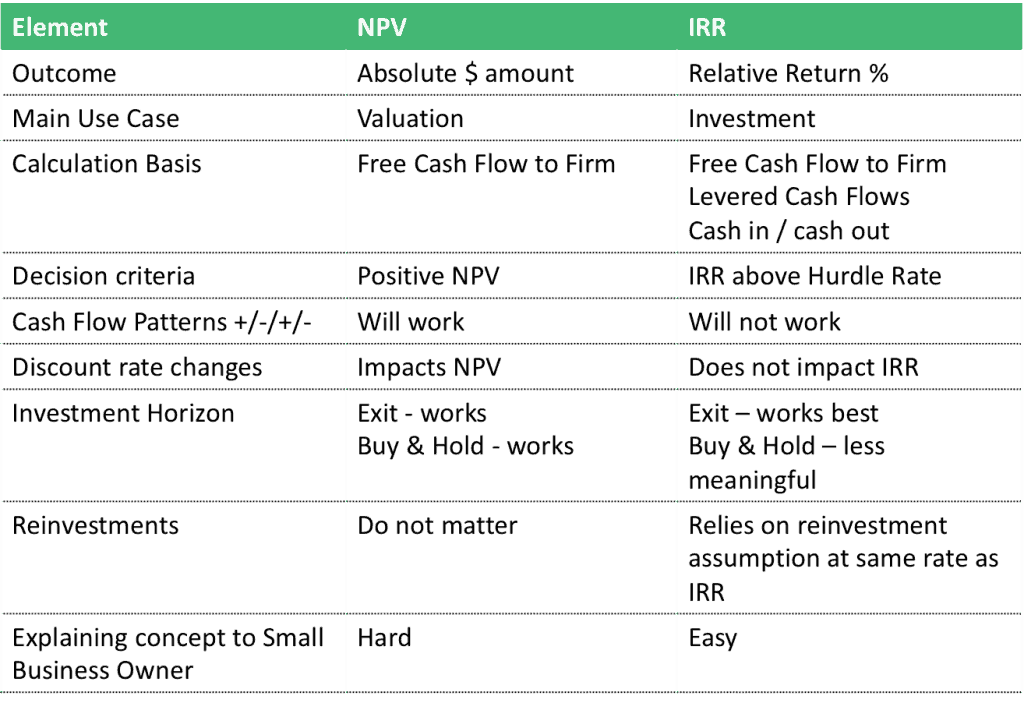
Understanding the concepts and differences between IRR vs NPV is important when having to rely on them when making financial decisions. Both concepts have their merits and its limitations but also both concepts are way too important as they should be ignored. What is important is to obtain a solid understanding of each method and depending on the use case rely more on the explanatory of one of the two metrics – IRR or NPV – or use them in combination. Please check out the financial model templates below which use NPV and IRR concept in their analysis.
Financial Models with IRR Calculation
No Downloads found
Financial Models with NPV Calculation
No Downloads found
You might also like:
- How to Calculate Net Present Value (NPV)?
- Leveraged vs. Unleveraged IRR: What You Need to Know
- Mastering the Art of IRR Calculation: A Comprehensive Guide for Investors
- Key Financial Ratios
- How to Value a Business Using a Discounted Cash Flow Model
- Master the Free Cash Flow Formula for Smarter Financial Decisions
- Financial Modeling for Startups and Small Businesses
- 10 Tips to Develop a First Class Business Valuation Report
- Understanding the Debt Service Coverage Ratio: An Essential Metric for Financial Analysis
- Understanding What is Yield to Maturity and Why It Matters
- How to Prepare a Financial Feasibility Study?
- Financial Forecasting Models by eFinancialModels
- Financial Model Templates Easy to Use
- 10 Main Elements of a Business Plan
- All About Financial Modeling for Project Finance
- Investment Multiple
- 5 Practical Tips to Help Raise Funds For Startups
- Cash Flow Analysis in Excel
- 10-STEP FINANCIAL PLANNING CHECKLIST FOR SMART EXECUTIVES
- Budgeting
