0 ITEMS

Break-Even Analysis: How to Calculate Your Exact Number

Key Takeaways
- Break-even units equal fixed costs divided by contribution margin per unit, and most small businesses can calculate this in under 10 minutes with three inputs.
- The U.S. Small Business Administration lists startup and operating cost estimation as a required step before a business plan is considered lender-ready (SBA).
- A 10% drop in your selling price can raise your break-even volume by 20% or more, because price cuts hit contribution margin directly, not just revenue.
- Excel’s Goal Seek function solves break-even volume automatically when the formula relationship is not obvious, without manual trial and error (Microsoft Support).
- The Census Bureau’s Statistics of U.S. Businesses shows small firms with fewer than 20 employees account for the vast majority of U.S. business establishments, which is exactly the population that most needs a fast break-even check before spending cash (U.S. Census Bureau).
- Break-even in dollars, not just units, matters for service businesses and subscription models where “units” are not a clean physical count.
- Rebuilding your break-even point every time a major cost or price changes takes minutes in a spreadsheet and prevents pricing decisions made on stale assumptions.
What Is Break-Even Analysis?
Break-even analysis tells you the exact sales volume or revenue at which your business stops losing money and starts covering its costs, with zero profit and zero loss at that point. Below that number you lose money; above it, every additional sale contributes to profit. The calculation rests on three inputs: fixed costs, variable cost per unit, and price per unit.
Fixed costs are expenses that do not change with sales volume, such as rent, salaried payroll, and loan payments. Variable costs move with each unit sold, such as materials, direct labor, and shipping. The gap between price and variable cost per unit is your contribution margin, the amount each sale contributes toward covering fixed costs before any profit exists.
Small businesses use break-even analysis before launching a product, setting a price, or taking on new fixed costs like a lease or a hire. The SBA identifies startup cost estimation, which includes break-even thinking, as a core planning step for any business seeking financing or investment (SBA).
How Do You Calculate the Break-Even Point?
You calculate break-even units by dividing total fixed costs by the contribution margin per unit, where contribution margin equals price minus variable cost per unit. The formula is:
Break-even units = Fixed Costs ÷ (Price per unit − Variable cost per unit)
To get break-even in revenue dollars instead of units, multiply the break-even unit count by the price per unit, or use the contribution margin ratio:
Break-even revenue = Fixed Costs ÷ (Contribution Margin ÷ Price)
Consider a small bakery with $4,000 in monthly fixed costs (rent, insurance, one salaried baker), a $6.00 price per specialty cake, and $2.50 in variable cost per cake (ingredients, packaging, hourly staff time). Contribution margin per cake is $3.50 ($6.00 minus $2.50). Break-even units equal $4,000 divided by $3.50, or 1,143 cakes per month, roughly 38 cakes per day. Below that volume the bakery loses money every month; above it, each cake nets $3.50 in profit.
Worked Excel Example: Break-Even for a Service Business
The same math applies to a service business with hourly billing instead of physical units. A three-person bookkeeping firm has $9,000 in monthly fixed costs (office lease, software subscriptions, one salaried admin), bills clients $85 per hour, and incurs $35 per hour in variable cost (contractor pay, per-client software fees). Contribution margin per billable hour is $50.
Break-even hours equal $9,000 divided by $50, or 180 billable hours per month across the whole team, about 60 hours per bookkeeper in a three-person shop. If the firm raises its rate to $95 per hour without changing costs, contribution margin rises to $60 per hour and break-even drops to 150 hours, a meaningful cushion built from a single pricing decision.
Building this in Excel with live formulas, not hardcoded numbers, lets you stress-test price and cost changes instantly. Structure the sheet with Fixed Costs, Price per Unit, and Variable Cost per Unit as input cells, then a Contribution Margin cell (=Price−VariableCost), and a Break-Even Units cell (=FixedCosts/ContributionMargin`). When any input changes, every downstream cell recalculates automatically. For break-even scenarios with more variables, Excel’s Goal Seek tool can solve for the exact price or volume needed to hit a target profit, rather than a $0 break-even, by adjusting one input until a target cell reaches your goal (Microsoft Support: Goal Seek and Solver).

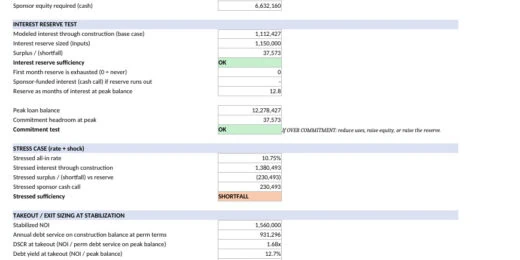
A formula-linked spreadsheet recalculates break-even instantly whenever price, fixed costs, or variable cost per unit changes.
Break-Even Methods Compared

Different cost structures, fixed versus variable, put businesses at very different break-even volumes even at identical revenue.
| Method | Best for | Data needed | Output |
|---|---|---|---|
| Unit-based formula | Physical product businesses (retail, food, manufacturing) | Fixed costs, price/unit, variable cost/unit | Units to sell per period |
| Revenue-based formula | Service or subscription businesses without discrete units | Fixed costs, contribution margin ratio | Dollar revenue to reach |
| Multi-product weighted average | Businesses selling several products at different margins | Sales mix percentage, margin per product line | Blended break-even units/revenue |
| Goal Seek / Solver in Excel | Complex models with multiple linked variables (pricing, volume, cost tiers together) | A built financial model with formula-linked cells | Exact input value needed to hit a target output |
Common Break-Even Analysis Mistakes
- Misclassifying costs as fixed when they are actually variable. Hourly contractor pay that scales with sales volume belongs in variable costs, not fixed costs. Fix: review every expense line and ask whether it changes if you sell zero units next month.
- Ignoring taxes and factoring only pre-tax numbers. A break-even point calculated without accounting for the tax treatment of the business entity understates the sales volume actually needed to keep cash flow positive. Fix: cross-check the calculation against your entity’s filing obligations using IRS guidance for small businesses (IRS).
- Using average variable cost across products that have very different margins. A single blended number hides which product lines are actually profitable. Fix: calculate break-even separately per product line, then weight by sales mix.
- Forgetting to update the model after a price or cost change. A break-even point calculated once at launch and never revisited becomes stale within a quarter as rent, supplier prices, or wages shift. Fix: rebuild the calculation whenever any major fixed or variable cost changes, which takes minutes with formula-linked cells instead of hardcoded numbers.
- Treating break-even as a one-time exercise instead of an ongoing pricing tool. Fix: run break-even analysis before every material pricing decision, not just once during initial planning.
Tools and Templates for Break-Even Analysis

A pre-built, formula-linked template turns break-even from a one-time calculation into a reusable planning tool.
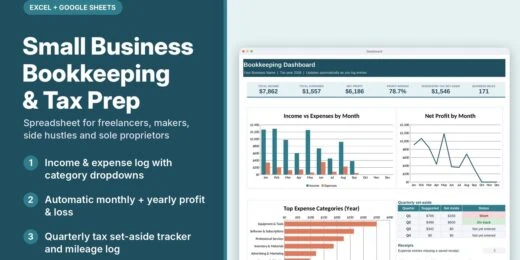
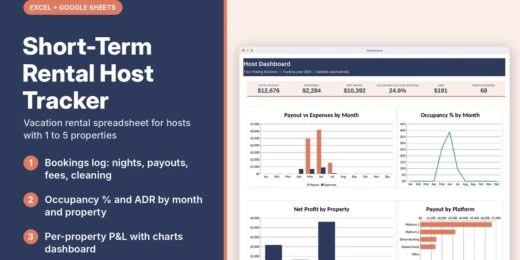
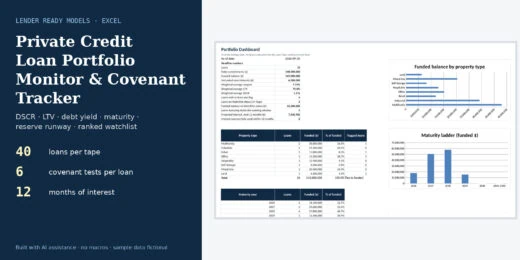
A pre-built spreadsheet with formula-linked cells lets you change fixed costs, price, or variable cost per unit and see the break-even point update instantly, without rebuilding formulas from scratch. eFinancialModels maintains a library of financial modeling templates, including free three-statement and cash flow starting points, that founders and finance teams can adapt for break-even and margin analysis alongside a full financial plan (eFinancialModels).
Frequently Asked Questions
What is the difference between break-even point in units and break-even point in dollars?
Break-even units tell you how many individual items or billable hours you must sell to cover all fixed and variable costs, useful for businesses with a clear per-unit price like a bakery or a manufacturer. Break-even in dollars tells you the total revenue needed to reach the same point, which is more useful for service businesses, subscription models, or any company selling multiple products at different prices where a single “unit” count does not exist. You calculate dollars by dividing fixed costs by the contribution margin ratio (contribution margin divided by price), or simply by multiplying break-even units by the price per unit once you know both.
How does a price increase affect the break-even point?
Raising price without changing variable cost increases contribution margin per unit, which lowers the number of units needed to break even. In the bookkeeping firm example above, raising the hourly rate from $85 to $95 increased contribution margin from $50 to $60 per hour and cut break-even hours from 180 to 150 per month, a 17% reduction from a single pricing change. This is why break-even analysis is a pricing tool, not just a cost-recovery calculation: small price changes often move break-even volume more than proportional cost cuts do.
Can break-even analysis work for a business with multiple products at different prices?
Yes, using a weighted average contribution margin based on your sales mix. Calculate the contribution margin for each product line, multiply each by the percentage of total sales it represents, and sum the results to get a blended contribution margin. Divide total fixed costs by that blended figure to get a break-even unit count across the whole product mix. This method requires reliable sales mix data, so it works best once a business has at least a few months of sales history to establish what percentage each product actually represents.
Does break-even analysis account for taxes?
The basic formula does not include taxes; it calculates the point at which revenue equals total costs before any tax liability. Because tax obligations still apply to profitable periods and can affect cash flow timing, businesses should treat the standard break-even number as a pre-tax operating threshold, not a complete cash flow picture. The IRS provides guidance for small businesses on filing obligations and estimated tax payments that should be layered on top of the operating break-even calculation (IRS).
How often should a small business recalculate its break-even point?
Recalculate whenever a major fixed cost changes (new lease, new hire, new loan payment), whenever variable costs shift meaningfully (supplier price increase, wage change), or whenever you consider a price change. Many businesses also review break-even quarterly as a standing check, even without a specific trigger, because supplier costs and labor costs drift gradually and can erode margin without a single dramatic change. A spreadsheet model with formula-linked cells makes this a five-minute task instead of a rebuild.
What is the difference between break-even analysis and a full financial model?
Break-even analysis answers one specific question: what sales volume or revenue covers costs with zero profit and zero loss. A full financial model extends that logic across multiple future periods, incorporates growth assumptions, financing, taxes, and working capital, and produces projected income statements, balance sheets, and cash flow statements. Break-even analysis is typically a single calculation or a small module inside a larger financial model, useful as a quick sanity check before building out the full three-statement projection.
Why do two businesses with identical revenue have different break-even points?
Break-even depends on the ratio of fixed to variable costs, not on revenue alone. A business with high fixed costs and low variable costs per unit, such as a software company, needs a smaller number of high-margin sales to break even but faces more risk if sales fall short. A business with low fixed costs and high variable costs per unit, such as a reseller, needs more volume to reach the same profit level but has less fixed-cost risk if sales are slow. Two businesses can post identical revenue in a given month while sitting on very different sides of their respective break-even points, depending entirely on their cost structure.
Conclusion
Break-even analysis turns a vague sense of “we need to sell more” into an exact number you can track, test, and defend to a lender or investor. Start with the simple unit formula, rebuild it in a spreadsheet with formula-linked cells rather than hardcoded numbers, and revisit it every time a major cost or price changes. I recommend starting from a proven financial modeling template rather than building formulas from scratch, since a formula-linked template lets you test pricing and cost scenarios in minutes; browse eFinancialModels’ full library of financial modeling templates to find a starting point that matches your business type.
[“
“]