0 ITEMS

What is Return on Invested Capital (ROIC)?
Table of Content
- Why Do Investors Use ROIC in Analyzing Investments?
- What is the Formula for calculating Return on Invested Capital?
- A ROIC Calculation Example
- Calculating Economic Profit from Return on Invested Capital
- Return on Invested Capital vs. Return on Equity
- Return on Assets (ROA) vs. ROIC
- What are the Limitations of Return on Invested Capital?
- Return on Invested Capital measures the Financial effectiveness of the Business Model

Have you heard of the term Fuel Efficiency? I am sure car owners are very familiar with this term. Fuel Efficiency is the mileage or kilometers a car can travel with a liter of gas. In investments, there is an equivalent term for Fuel Efficiency, which is the Return on Invested Capital (ROIC). The amount of invested capital is the fuel, and the return or profit is the kilometers or mileage traveled.
The Return on Invested Capital (ROIC) is an economic profitability ratio that measures the operating returns of the capital invested in a company. ROIC can be calculated by dividing the annual Net Operating Profit Less Adjusted Taxes by the Invested Capital. ROIC measures how profitable a company’s management can deploy the invested capital and allows profit comparisons with peer companies, historical trend analysis, and a better estimation of how profitability might develop in the future. ROIC is also an indicator of premium profitability when comparing the ROIC to a company’s cost of capital.
Please note that ROIC excludes the effects of financial engineering (financial leverage) and only focuses on the company’s after-tax profitability from the invested capital into the company.
This video explains what is return on invested capital:
Why Do Investors Use ROIC in Analyzing Investments?
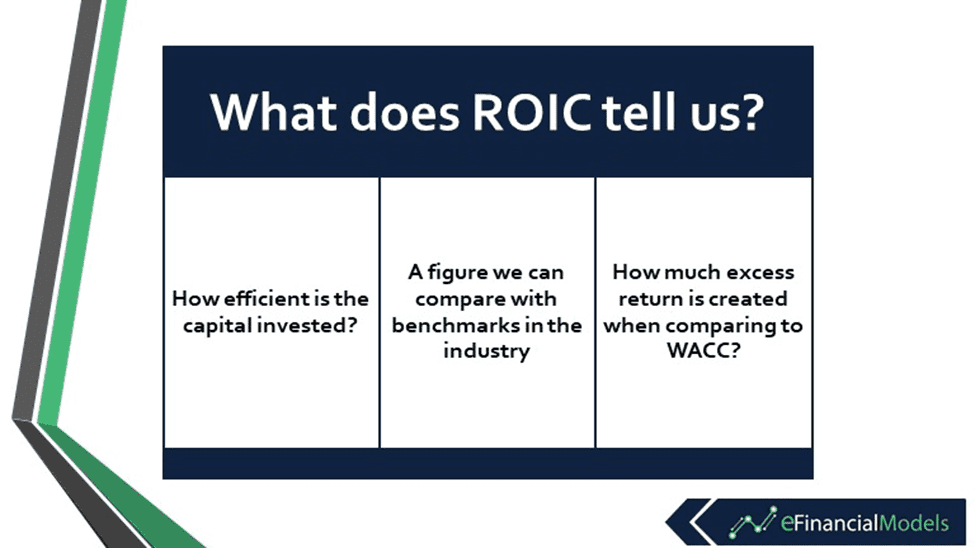
When investing in a company, investors’ key concern is that their capital is deployed effectively, leading to profits for the company and its shareholders. The Return on Invested Capital tells investors the level of profitability of capital invested in a company and allows them to assess the level of excess returns created by the company’s management team compared to its cost of capital. Unlike a profit margin such as the EBITDA margin, Return on Invested Capital also uses information from a company’s balance sheet to focus on its invested capital’s profitability. The ROIC tells investors how much profit their capital providers can obtain from a company from every dollar invested. If Return on Invested Capital is higher than the Weighted Average Cost of Capital (WACC), this shows that the management is able to effectively use new investments to create excess returns above the required returns as measured by a company’s WACC.
ROIC helps capital providers and company management in analyzing the financial profitability potential of investments in several ways, such as:
Financial Performance Measurement
ROIC allows capital providers to understand how much return a company could generate on its invested capital and how to compare this return to the minimum required return which is the Weighted Average Cost of Capital (WACC). The aim is that ROIC should be greater than the WACC; this means that the company creates economic profit on the required capital. Economic Profit, in this sense, is the difference between the ROIC and WACC. While if the ROIC is less than WACC, the company cannot create but destroys value since investors would be better off investing their money in stocks with similar risks, which should result in a return similar to the WACC. The beauty of ROIC is that the required information for its calculation can be obtained from a company’s Balance Sheet and Income Statement. To conclude, ROIC is a financial ratio investors and shareholders typically would want to know.
Forecasting
ROIC helps analysts better analyze a company’s 3-5-year financial forecast by calculating ROIC. If financial projections show an abnormally high ROIC compared to historic years or peer companies in the industry, this would indicate that costs might be missing or the forecast is simply too optimistic. Also, having a financial forecast with a high ROIC raises the question of how long this can go on before competitors discover this market niche and start competing on price, driving ROIC down. Given that ROIC focuses on the operating profitability of the invested capital, calculating the resulting ROIC of a Three Statement Forecast can lead to better forecast quality.
Forecasting Terminal Value
The problem in using a standard Gordon Growth Model for estimating Terminal Value is that capitalizing a Free Cash Flow at the end of the forecast period with a high ROIC assumes a (growing) competitive advantage forever. In reality, this is not realistic. Typically, companies follow a lifecycle model, and high ROICs attract competitors at some point, driving ROIC down. Therefore, for estimating Terminal Value, ROIC is a valuable indicator. A more sophisticated method to estimate Terminal Value than the standard Gordon Growth model is to use a Two-Stake Value Driver model where high ROIC can be modeled to come down close to the WACC over time.
Here is a summary of the Uses of Return on Invested Capital (ROIC), Financial Performance Measurement, Analyzing The Quality of the Financial Forecast, and Forecasting Terminal Value.

What is the Formula for calculating Return on Invested Capital?
ROIC can be calculated using select figures included in the Financial Statement of a company from the Balance Sheet, and the Income Statement since the formula for calculating ROIC consists of a profitability measure and a capital divider:
ROIC = NOPLAT / Invested Capital
Operating Profit Less Adjusted Tax (NOPLAT) measures a company’s after-tax profit from its operations. The literature often refers to Net Operating Profit after Tax (NOPAT). Still, since the profits are before deducting interest, we use a pro-forma tax adjustment to Net Operating Profits and therefore use NOPLAT. In our definition, Net Operating Profits are the same as Earnings before Interest and Taxes (EBIT). We now extract EBIT from a company’s financial statement and deduct pro forma taxes by using the company’s Income Tax Rate:
NOPLAT = EBIT * (1 – tax rate)
Invested Capital can be derived from a company’s Balance Sheet by adding the Equity Capital to the Financial Debt and deducing Cash. Please note that cash is deducted as we assume that the cash could be used to repay a company’s debt. Therefore, Financial Debt minus Cash represents Net Debt. If a company had a lot of non-operating assets, these would also need to be excluded from the Invested Capital calculation.
Invested Capital = Equity + Financial Debt – Cash
ROIC can now be computed by dividing the Net Operating Profits Less Adjusted Tax (NOPLAT) over the Invested Capital. Given that NOPLAT was derived using an annual EBIT figure, the question might be raised about which Invested Capital we are using. A company’s beginning balance or a company’s year-end balance. To solve this, we are using the average of both, hence the Average Invested Capital.

A ROIC Calculation Example
Below, we present an illustrative example of how ROIC can be calculated from a company’s Financial Statement. What we need is the company’s Income Statement and Balance Sheet.

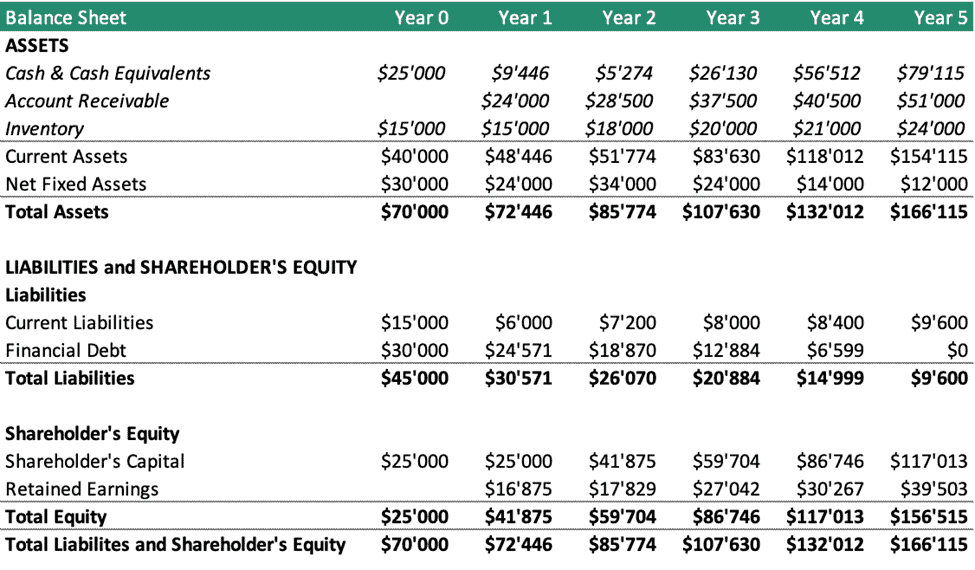
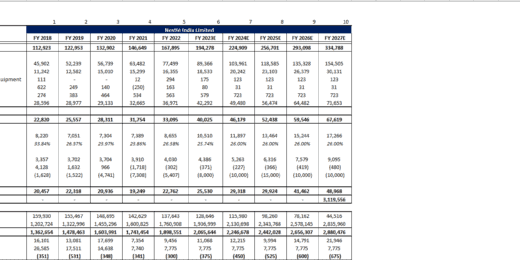
We then will need to calculate NOPLAT. We can do this by extracting EBIT from a company’s Income Statement and deducting a tax charge corresponding to the company’s Income Tax Rate to get to NOPLAT. As we can see below, we can calculate NOPLAT for all available Financial Years.
To calculate Invested Capital, we need to add Shareholder’s Equity to Financial Debt and deduct the Cash (assuming the cash could be used to repay the debt). This will now lead to the Invested Capital, the capital required to capitalize on our business.
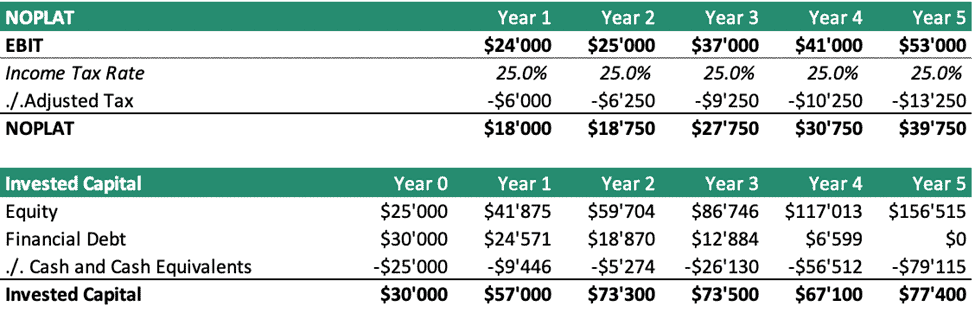
The next step is to divide NOPLAT by Invested Capital. Here we take the average of the Invested Capital Positions between the previous and current year to catch changes. We now can see that this business does not require a lot of capital to be invested and is able to generate a significant return. As per the figures below, every dollar invested in the business yielded a profit after tax between 28.8% and up to 55.0%.

Calculating Economic Profit from Return on Invested Capital
For the purpose of this article, we define economic profit as the difference between the ROIC and the WACC.
In order to better understand ROIC, we can now compare the ROIC to the company’s cost of capital, the Weighted Average Cost of Capital (WACC). As you can see below, it is significantly higher than the company’s cost of capital of 12.0%. The difference is the excess return or economic profit this business creates.
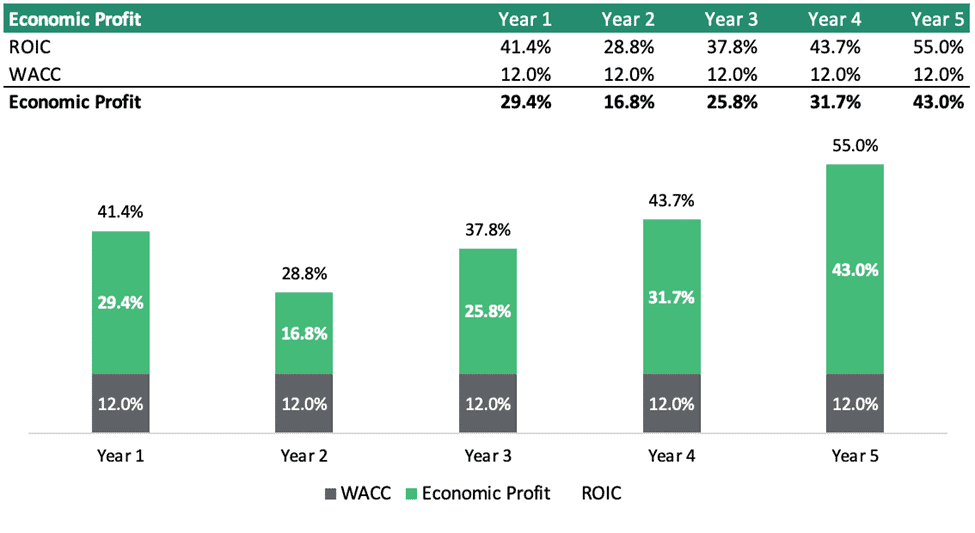
This means, that investing in this business leads to a higher return than a comparable investment on the stock market in stock with similar risk, which would only yield a 12.0% return per year.
This now helps us to build a solid investment case as we can claim it’s a good idea to invest capital into this business compared to the other alternatives.
The only question remaining would be how long this business will be able to generate excess returns, but this is another subject.
Return on Invested Capital vs. Return on Equity
We now also like to understand what is the difference between ROIC and another well-known measure of a company’s profitability, the Return on Equity (ROE).
Return on Equity
Return on Equity (ROE) measures a company’s profit in relation to the equity position on the balance sheet. The formula is the following:

ROE tells us how much shareholders receive in compensation for the capital which belongs to them. The problem with this ratio is that it is purely taken from an accounting point of view. What happens if a company uses a lot of debt for financing (leverage)? In that case, ROE becomes distorted because if a company uses a lot of cheap financial debt, it can artificially inflate its return to shareholders but is also subject to a higher degree of risk.
When calculating ROIC, we use Invested Capital which is a capital position not only for the equity shareholders but also for the debt holders. We cannot compare ROE to ROIC, as ROE benefits from financial leverage, but ROIC doesn’t. Compared with ROIC, ROE focuses on the profits generated by the Equity, while ROIC focuses on the earnings from both investments generated from equity and debt.
This means we should not compare ROE to ROIC. How about we compare the Return on Assets (ROA) to ROIC
Return on Assets (ROA) vs. ROIC
Return on Assets (ROA) measures the returns that the company’s assets generate. Same as ROE, ROA uses accounting figures. However, this time, we also have to consider the interest as this is the compensation debt holders receive.

Now our comparison becomes closer as we try to analyze the company focusing on the assets this company required and the resulting returns. What is then the difference between ROA and ROIC?
- Both profitability ratios show profits after tax.
- ROA uses total assets from the balance sheet. If a company has a lot of unused cash on its balance sheet, ROA will be lower and will not reflect what the business can return in terms of profits
- ROA adds back the interest expenses and Net Income. The problem is that Net Income is lower when a lot of debt is used, reducing the tax expense. This means ROA still benefits from the tax shield created by using financial debt. Therefore, Net Income is still affected by financial engineering.
- ROIC solves this problem as we deduct cash from debt, assuming it can be used to repay the debt. Invested Capital only reflects the capital required to run this business and removes excess capital.
- This means our perspective changes now. Instead of an accounting perspective, ROIC uses an economic perspective, making ROIC much better than other businesses as ROIC reflects the profits of the capital required to run this business.
We can illustrate our point with the following example below. We again use the average Equity, Assets, and Invested Capital balances to calculate the profitability ratios ROE, ROA, and ROIC.
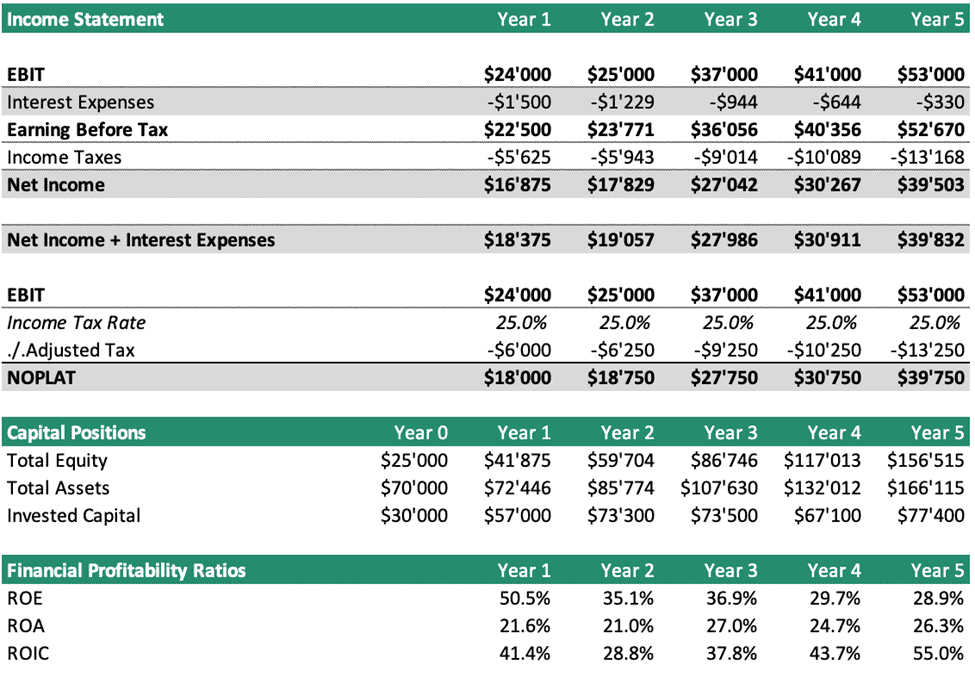
- ROE in the first year is affected by a lot of financial debt. Therefore, it is quite high since most financing comes from equity, not debt.
- In the last three years, when you would only look at ROE, it would look that the company’s financial performance has worsened in the last three years while it is improving when looking at ROIC.
- ROA would also indicate an improving performance, but the ratio should not rely on itself since it is still affected by excess cash on the company’s balance sheet.
As you can see above, it pays off to calculate and analyze ROIC as we can obtain better insights into a company’s financial performance.
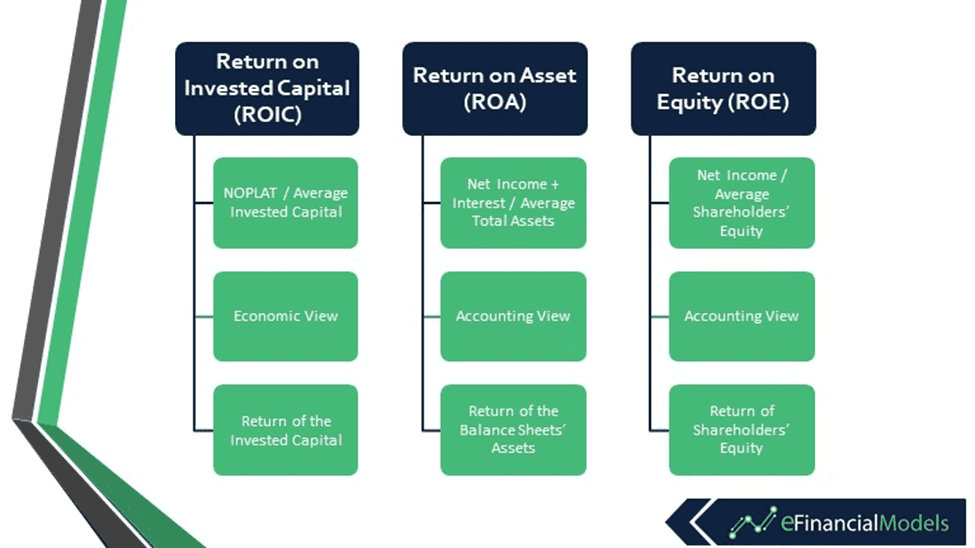
Below we have listed a comparison table between ROIC, ROA, and ROE.
What are the Limitations of Return on Invested Capital?
As shown previously, ROIC is a great financial ratio to calculate when analyzing a company. Still, it has some limitations, which we would like to list below:
Companies with Multiple Business Segments
ROIC would also be very useful to calculate when we would like to analyze and compare the financial performance of business segments and not only the overall company performance. This would require that we break down how much NOPLAT is created by each business segment and which business segment requires how much of the invested capital. In reality, such information is rarely fully available with the required accuracy.
Excludes Non-Operating Assets
As mentioned above, when calculating Invested Capital, we should exclude the effects of non-operating assets. This requires accurate data and analysis to exclude it. In addition, income from non-operating assets might be included in EBIT. Our analysis is only as good as the quality of EBIT, which is then used to calculate NOPLAT.
Depreciation
EBIT and, therefore, NOPLAT are calculated after deducting depreciation. Depreciation is an accounting estimate that depreciates fixed assets over their useful life per a chosen depreciation Schedule. These estimates can easily be manipulated by management, and therefore EBIT might be distorted, leading to an inaccurate calculation of ROIC.
Return on Invested Capital measures the Financial effectiveness of the Business Model
Overall Return on Invested Capital (ROIC) is a very useful financial ratio to track and understand for a company since it offers insight into how well a company can invest the entrusted capital to generate profits. Therefore, often ROIC is also used when evaluating the effectiveness of the business model from a financial perspective. The higher the ROIC, the more attractive a company is from a financial perspective. The calculation of ROIC provides not only the current standing of the company but also provides a benchmark for its financial forecasts, allowing for a true comparison of the financial performance to peer companies in its industry. ROIC also offers a tool to quantify how much value is created when comparing ROIC to the Cost of Capital.
Computing the ROIC of a company can be a little tricky. Fortunately, we have prepared an ROIC Calculator to help calculate ROIC over a 10-year period to better understand a company’s trend and historical economic performance.
Please also feel free to check out our list of templates for Excel Calculators: