
0 ITEMS

Community App Financial Model Case Study

Key Takeaways
- Early-stage founders of a lifestyle community app had first revenues and a few hundred paying subscribers, won mostly through paid ads.
- What mattered: acquisition cost (CAC) against lifetime value (CLV), per plan and cohort by cohort.
- Turning point: growth looked profitable, but CAC had to come down and CLV up first, so bootstrapping stayed the preferred route.
- Outcome: a five-year cohort-based model with break-even, scenarios, actual vs. forecast and a rolling forecast.
PDF0.6 MB
Free download · No email required
Download the Community App Financial Model Case Study
✓ Model structure✓ Key assumptions✓ Results and takeaways
Paid ads can buy growth quickly. Whether that growth builds a business is the question an investor asks first. What does a paying subscriber cost, and what does the subscriber earn over time? How much cash is needed until the app covers its costs, and what would new money buy? With a few months of data, a model is the way to see the answers before anyone asks.
The Client and the Decision
The founders had launched a lifestyle community app. It already generated first revenues, had a few hundred paying subscribers and was growing its members and subscribers, but it was still unprofitable. Customer acquisition ran mostly through paid ads. Analyzing a subscription business was new to the founders. They needed clarity on four questions: how much funding is required, how many paying subscribers are needed to break even, is growth profitable, and should they keep bootstrapping or raise funding? The hardest question to expect from an investor: why is a new subscriber worth more than it costs?
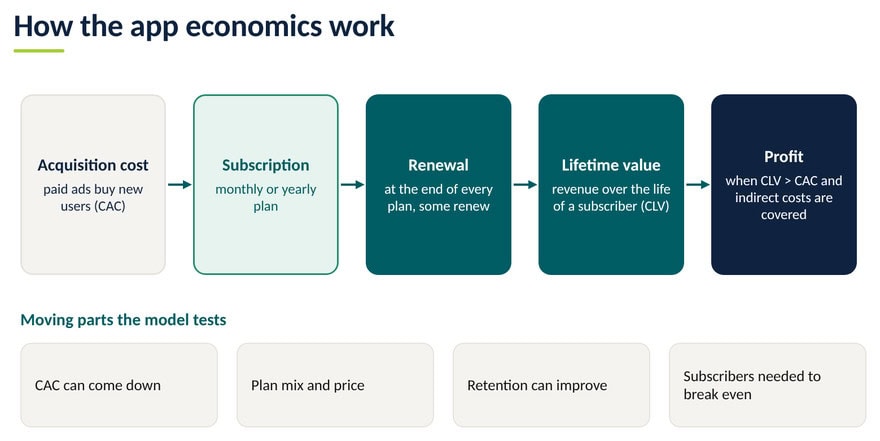
How the app economics work. A subscription app spends money up front and earns it back over time. Money goes into customer acquisition, the customer acquisition cost (CAC). New users then buy a subscription, either a monthly or a yearly plan. At the end of every plan comes a renewal, and some subscribers stay while others leave. Together, the renewals give an estimated customer lifetime value (CLV). Ideally, CLV is clearly bigger than CAC. The margin then has to cover the indirect costs of running the app, while user growth adds new subscribers. For a start-up, every one of these is a moving part: CAC can come down, and CLV can be improved.
Why This Was Hard to Model
- Is growth through paid ads profitable? Paid ads brought most new users. That only makes sense if each subscriber earns more over their lifetime than it cost to acquire them, and the answer can differ between a monthly and a yearly plan. How we solved it: We calculated CAC and estimated CLV for each plan, and compared the two.
- Break-even and the funding decision. The founders needed to know how many paying subscribers cover the costs, and how much cash they need until then. An investor would ask the same, and also what the money would pay for. How we solved it: We ran a break-even analysis in paying subscribers and showed the funding need under scenarios, so that bootstrapping and fundraising could be compared.
- Only a few months of data. The app had operated for only a few months. Subscriber, retention and cost data were still thin and not fully reliable, yet every forecast had to start from them. How we solved it: We analyzed the preliminary results, including subscribers, retention, acquisition costs, estimated lifetime value and other KPIs, and turned them into stated assumptions that can be updated as more data comes in.
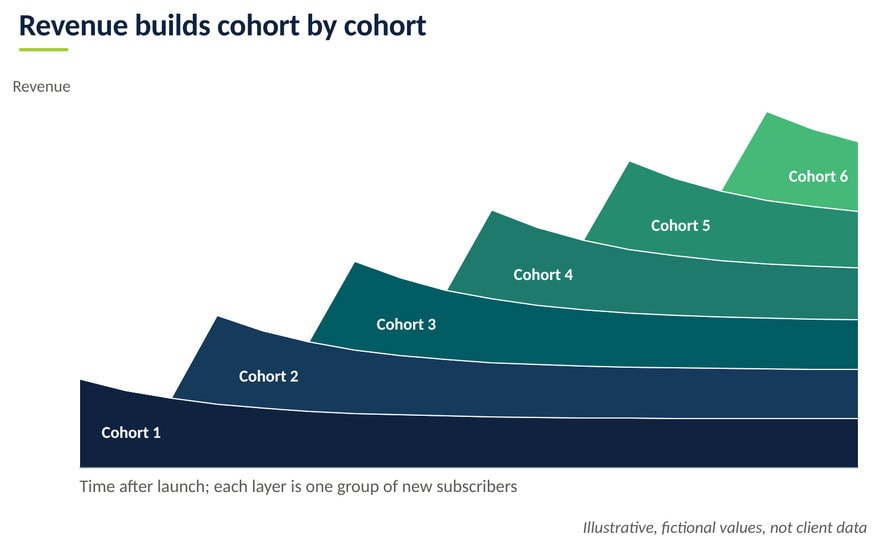
- Monthly and yearly plans, each with renewals. Subscribers choose different plans, and each plan renews at a different point in time. Total subscriber numbers hide how each group behaves, and a newer group may behave differently from an older one. How we solved it: We built a cohort model. It starts from the existing subscribers and costs, forecasts each new cohort, and builds revenue from the cohorts.
- From assumptions to a five-year forecast. Every line of the forecast depends on assumptions that move together: marketing budget, CAC, retention, hiring and operating costs. Changing one changes the others. How we solved it: We built a five-year financial forecast driven by the marketing budget, CAC, retention rates, the hiring and staffing plan and OPEX assumptions.
- Founders new to financial analysis. A model that only its builder understands cannot steer a business. The founders needed to follow every step to use it with confidence. How we solved it: We added an actual vs. forecast comparison and a rolling forecast that can be updated as the business goes, and explained the model in several rounds of discussion.
The Turning Point: From “How Much Should We Raise?” to “Which Lever Comes First?”
The founders came with a funding question. The cohort model changed the question. Growth through paid ads appeared to be profitable, but the gap between lifetime value and acquisition cost needed improvement: CAC had to come down and CLV had to go up. The model identified the levers to prioritize and showed the financial impact of each. With the funding need visible, bootstrapping turned out to be the preferred option. Fundraising stays an option if the pace needs to accelerate, but it is better to fine-tune the customer acquisition strategy first.
What Drives the Result
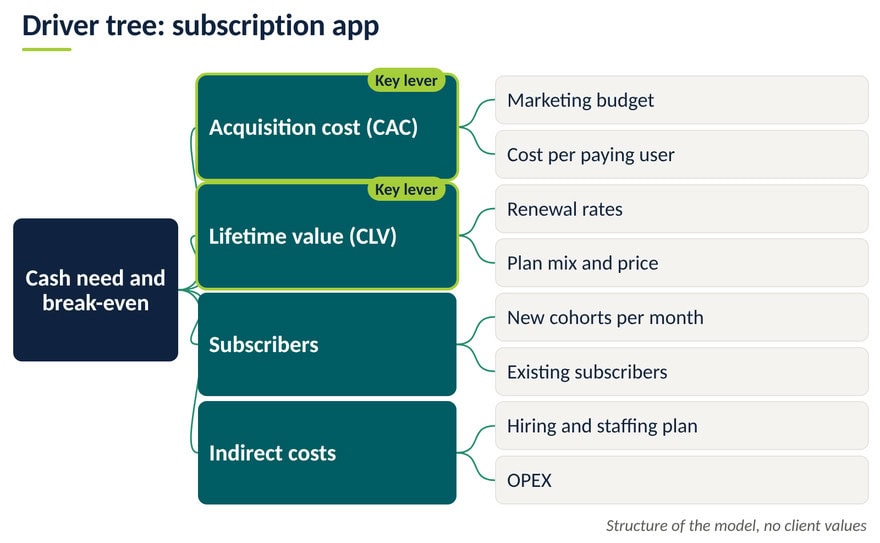
Two levers decide whether growth pays off: acquisition cost and lifetime value. Lifetime value depends on renewal rates, the mix of monthly and yearly plans and their prices. Indirect costs, mostly staff and operating expenses, set how many subscribers are needed to break even.
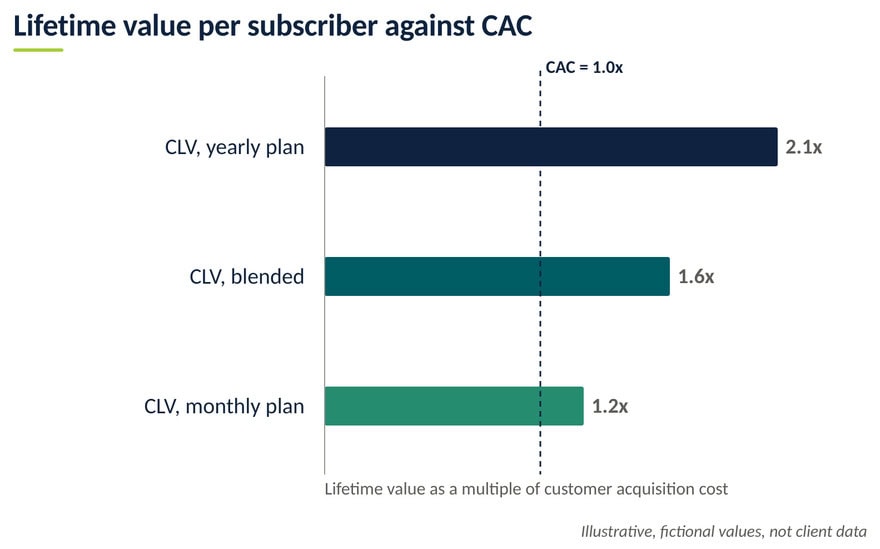
A worked example with fictional numbers shows how CLV and CAC compare.
Worked example with fictional numbers: lifetime value per plan against CAC
| Item | Monthly plan | Yearly plan |
| Price per period | 10 per month | 60 per year |
| Revenue kept after app store fees (assumed 70%) | 7 | 42 |
| Renewal rate per period | 85% | 50% |
| Expected periods = 1 / (1 – renewal rate) | 6.7 months | 2 years |
| Lifetime value (CLV) | 47 | 84 |
| CAC | 40 | 40 |
| CLV / CAC | 1.2 | 2.1 |
The monthly plan barely pays back, while the yearly plan has room. The next example varies CAC and renewal for the monthly plan.
Worked example with fictional numbers: three scenarios for the monthly plan
| Item | Worst case | Base case | Best case |
| CAC | 50 | 40 | 30 |
| Renewal rate per period | 80% | 85% | 88% |
| Lifetime value (CLV) | 35 | 47 | 58 |
| CLV / CAC | 0.7 | 1.2 | 1.9 |
What the scenarios show. Scenarios show how the case could work out; they do not prove the assumptions. In the worst case a new subscriber never pays back, and funding would only buy more of the same losses. In the best case there is room for indirect costs and for growth capital. The decision between bootstrapping and fundraising follows from which case the data supports.
How We Worked Together and the Result
How we worked together. We analyzed the first results and led the opening discussion on subscribers, retention and acquisition cost. We then planned the model with the founders and built the cohort model, the five-year forecast and the break-even analysis. Several rounds of discussion followed, answering follow-up questions and giving the founders a more in-depth understanding of their financial situation. Bootstrapping remains the preferred option, with fundraising kept in reserve. The result: the founders received a sophisticated financial model. It delivers:
- first metrics and transparency on the financial implications of the business case;
- a forecast with scenarios that shows the range of likely results under stated assumptions;
- the levers to prioritize, lower CAC and higher CLV, with their financial impact;
- a cohort analysis to compare actual results with the plan and see whether the app is on track.
Lessons and Questions for Anyone Modeling a Subscription App
Three lessons.
- Measure growth by cohort. Totals hide whether new subscribers pay back what they cost.
- Fix the unit economics before you raise. Funding accelerates what works; it does not lower CAC.
- Make the model a routine. Actual vs. forecast and a rolling forecast turn early guesses into evidence.
Questions to ask before you build a subscription app model.
- What does it cost to win one paying subscriber, and what does that subscriber earn over a lifetime?
- Is lifetime value clearly above acquisition cost, per plan?
- How many subscribers renew at the end of each monthly and yearly plan?
- How many paying subscribers cover the indirect costs, and how much cash is needed until break-even?
- What would new funding pay for, and what return could it earn?
- What happens to cash in the worst case, if CAC rises or renewals fall?
- Which lever moves the result most: lower CAC, better retention, plan mix or price?
- Are the new cohorts on track against the forecast?
Planning a similar project? See our Mobile App financial model. If your app needs something specific, we build custom financial models. Write to us at [email protected].
FAQ
Short answers to the questions readers ask most often when they plan this type of model.
What is customer acquisition cost (CAC)?
CAC is what it costs to win one paying customer. For an app, it is usually the marketing spend, such as paid ads, divided by the number of new paying subscribers it brings. Many users install an app without paying, so CAC per paying subscriber is higher than the cost per install, and that is the figure that matters.
How do you estimate customer lifetime value with only a few months of data?
Start from what you can observe: price per plan, the revenue kept after app store fees, and the first renewal rates. With little history, treat these as assumptions, test a range in scenarios and update them as each cohort renews. RevenueCat data on over 115,000 apps shows first-year retention for annual plans fell from 31% to 28% between 2023 and 2024, and for monthly plans from 10% to 8%.
What is a cohort analysis?
A cohort is a group of subscribers who joined in the same period. Cohort analysis follows each group over time: how many renew and how much revenue they bring against what they cost to acquire. It shows whether newer cohorts behave better or worse than older ones.
Should an app start-up bootstrap or raise funding?
It depends on the unit economics and the cash need. If CLV is not yet clearly above CAC, funding mainly buys more of the same losses, so improving acquisition and retention first is often better. Once each subscriber pays back, funding can accelerate growth.
Sources
Client details are anonymised to protect confidentiality. Charts, schematics and worked examples are illustrative and contain no client data.


