
0 ITEMS

What Is The Duck Curve? – Electricity Pricing In The Age of Solar and Batteries
Table of Content
- What Is The Duck Curve?
- What Are Negative Electricity Prices?
- Duck Curve: Weekdays vs Weekends
- How Does The Duck Curve Challenge Electricity Grids?
- The Demand Surge Behind Modern Grid Challenges
- How Rising Solar Capacity Deepens Grid Imbalance?
- What Is Battery Energy Storage System (BESS)?
- Take Advantage Of The Duck Curve With A Battery Energy Storage System (BESS)
- Future Challenges For Electricity Grids
- Conclusion
The Duck Curve illustrates the growing challenge of balancing electricity supply and demand as solar energy becomes more prevalent in the electricity mix. In this article, we are going to explain:
- How midday solar overproduction and steep evening demand spikes place significant strain on power grids by creating an imbalance between electricity generation and demand.
- The result of this imbalance is the Duck Curve of electricity prices during the day. The electricity price is lowest at noon when solar electricity production peaks and high in the evening once solar production comes to a halt. The shape of the electricity curve resembles a Duck, ergo the name Duck Curve.
- This opens up new opportunities to take advantage of these pricing imbalances when adding a Battery Energy Storage System (BESS) to a solar park. The Battery allows for storing the produced electricity when the price is low at midday until the price is higher in the evening and sells at the best possible price.
- A thorough financial analysis of a Solar + Battery Energy Storage Systems (BESS) project is needed to analyze the operational and economic impact, allowing for profit from new price arbitrage opportunities.
- Please note that the Duck Curve does not explain or address seasonal differences between electricity supply and demand in winter vs. summer; it focuses solely on electricity price differences during the hours of the day.
What Is The Duck Curve?
The Duck Curve visually illustrates how electricity prices are affected by the mismatch between electricity production and demand. First introduced by the California Independent System Operator (CAISO) in 2013, it has become one of the most well-known examples of the challenges in maintaining grid stability. In simple terms, the Duck Curve is created by plotting electricity prices or net demand (total demand minus electricity production) over 24 hours. During midday, when solar output is at its peak, net demand or prices drop sharply. And as the sun sets and solar production declines, prices rise steeply, forming a shape that resembles the silhouette of a duck, hence the name.
The Duck Curve highlights the fundamental limitations of Fixed Pricing, the traditional model where consumers pay a static rate regardless of when they consume electricity, offering high predictability but failing to provide a financial incentive to reduce demand when supply is low. This artificial price structure exacerbates the grid imbalance because consumers aren’t encouraged to shift their usage away from the steep, expensive evening ramp, leading to Demand when Supply is Low. To combat this, utilities are shifting toward Dynamic Pricing.
What is Dynamic Pricing?
Dynamic Pricing (also called time-based pricing or real-time pricing) is an electricity rate structure where prices fluctuate according to the actual cost of generation and demand at different times of the day. Unlike Fixed Pricing, where consumers pay a constant rate regardless of when they use electricity, dynamic pricing adjusts rates based on grid conditions.
This system provides financial incentives for consumers to shift energy use to off-peak hours, improving grid stability and efficiency. It operates through smart grids and smart meters that collect real-time data on consumption and generation, enabling utilities to set prices dynamically and communicate them instantly to users. This helps balance supply and demand, reduces strain during peak periods, and supports greater integration of renewable energy into the power system.
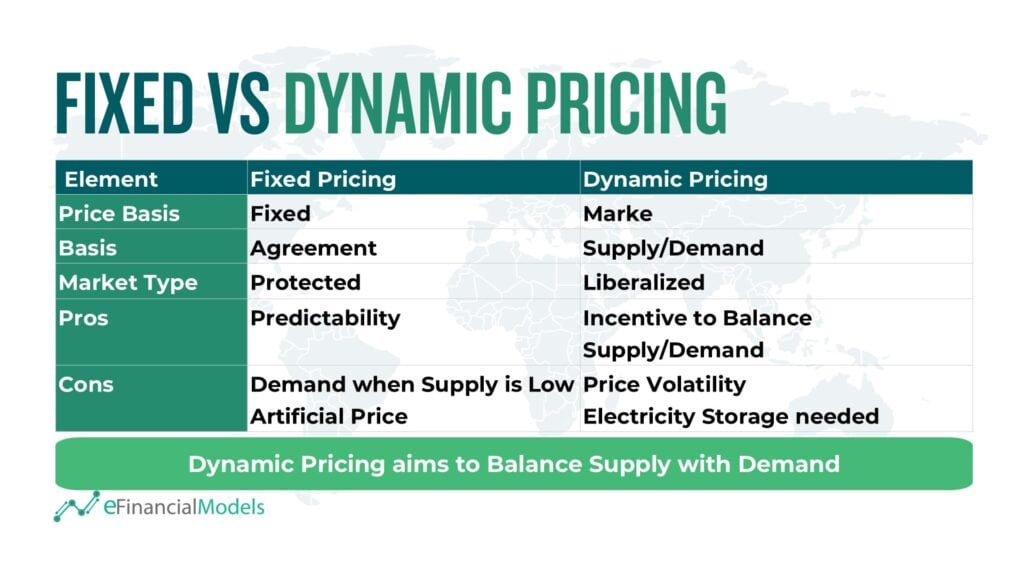
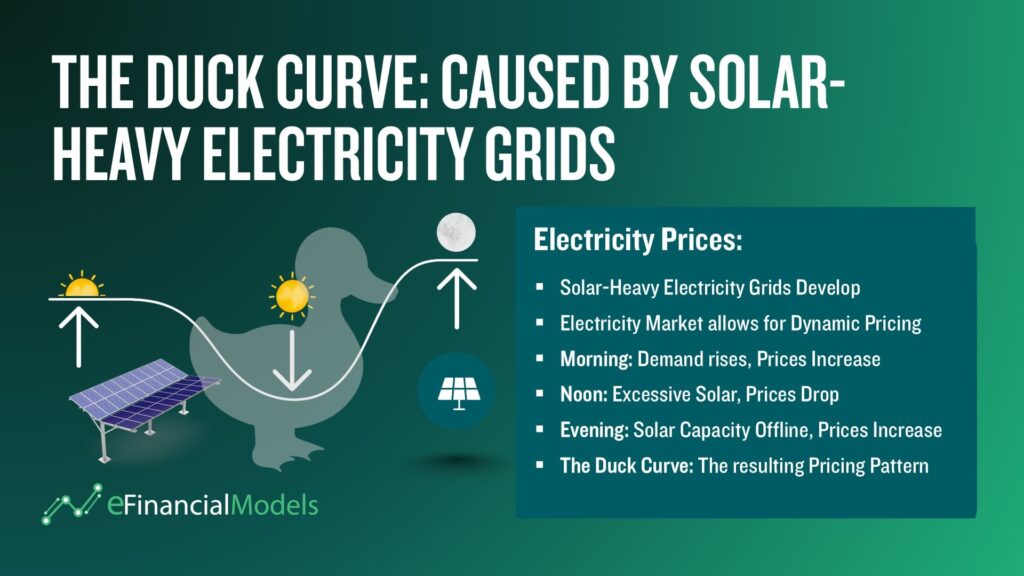
In essence, the Duck Curve isn’t just a visual illustration, it’s a pricing pattern born from solar-heavy electricity grids. As utilities adopt Dynamic Pricing to reflect real-time supply and demand, the curve itself becomes a daily map of market behavior. The midday dip and evening spike in prices directly mirror solar generation’s rise and fall, making the Duck Curve a byproduct of how solar reshapes grid economics. Each segment of the curve, the morning ramp, midday trough, and evening peak, reveals a distinct phase in this cycle, reflecting the shifting balance between renewable generation and consumption. These parts of the curve will be discussed further in the next section.
The figure below, taken from our Solar + BESS Financial Model Template, demonstrates these daily dynamics. It shows how electricity consumption (grey line), solar energy production (light green bars), and battery storage activity (lime and dark green bars) interact throughout a typical day. The changing relationship between these elements illustrates the three main parts of the curve: the neck, the belly, and the tail.
- The Tail: Morning Ramp-Up
In the early morning hours, typically between 6:00 and 9:00 AM, electricity demand begins to climb as people start their daily routines and businesses open. During this time, solar production is still ramping up and remains lower than consumption levels. The gap between generation and demand creates the first rise in the Duck Curve, the “tail.” It reflects the grid’s need to quickly ramp up supply in response to growing consumption after the overnight low.
- The Belly: Midday Dip
Between 10:00 AM and 3:00 PM, the grid experiences the “belly” of the Duck Curve, a pronounced dip in electricity prices or net demand. This happens when power generation, particularly from daytime sources, exceeds total consumption. With supply outpacing demand, the grid records lower net load levels during this midday period. In some cases, this oversupply leads to negative electricity pricing, where producers are efficiently paid to reduce output rather than contribute to an overloaded grid. This phenomenon underscores the economic impact of midday overgeneration, which will be discussed in greater detail in the next portion of this article. Moreover, the belly highlights the challenge of maintaining balance when production temporarily surpasses what consumers are using.
- The Tail: Evening Ramp-Up
From 4:00 PM to 8:00 PM, the curve rises sharply again, forming the “neck.” As daylight fades and production from daytime sources declines, electricity demand remains high or continues to climb. This evening ramp requires rapid increases in generation to match consumption, creating one of the most demanding periods for grid operators. The neck illustrates how quickly supply must respond to shifting demand patterns to maintain system stability.
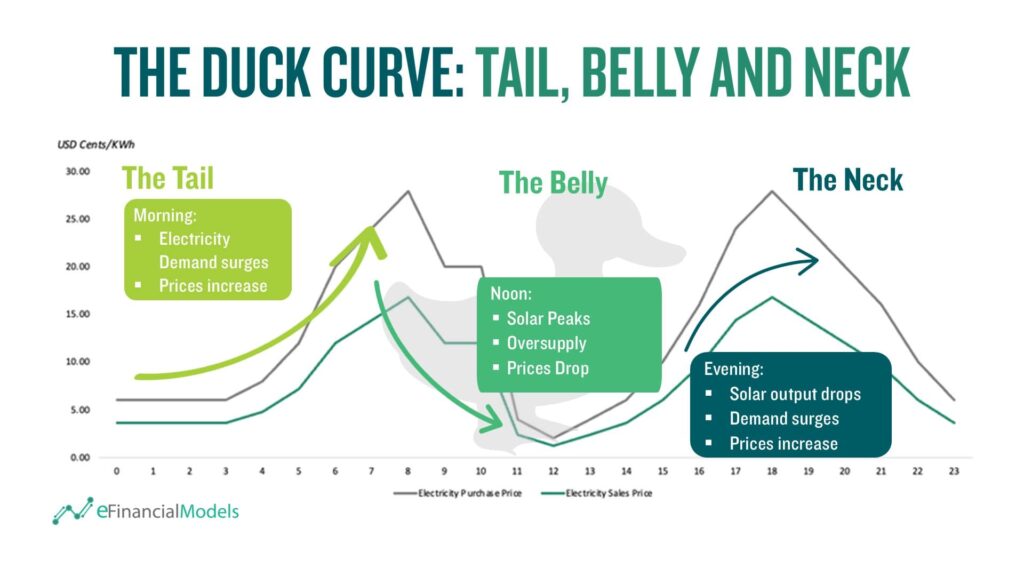
Overall, the Duck Curve captures the daily mismatch between electricity production and consumption as demand patterns shift throughout the day. Its shape reflects how the grid must adapt, from ramping up supply in the morning, managing excess generation midday, to meeting steep evening demand. During the midday period, oversupply can even result in negative pricing, highlighting how closely economic signals are tied to grid behavior. Understanding these dynamics is essential for planning efficient generation schedules, maintaining system reliability, and ensuring that electricity remains stable and responsive to consumer needs.
What Are Negative Electricity Prices?
The negative pricing in dynamic pricing occurs when electricity supply exceeds demand to such an extent that market prices fall below zero. In these instances, the wholesale electricity price drops below $0/MWh, meaning producers effectively pay buyers to absorb excess electricity. Such conditions often arise during periods of exceptionally high solar generation combined with low consumption, typically in mild weather or on weekends when industrial activity slows. Negative pricing serves as a market signal of oversupply, sending clear messages to both sides of the electricity market. For generators, it indicates that they should reduce output or risk paying to continue generating, since producing electricity when prices are below zero leads to financial losses. For consumers and energy storage operators, it signals an opportunity to increase consumption or charge batteries, effectively taking advantage of the surplus power. This two-sided response helps the grid absorb excess generation, stabilize system balance, and ensure that solar energy is utilized more efficiently rather than wasted.
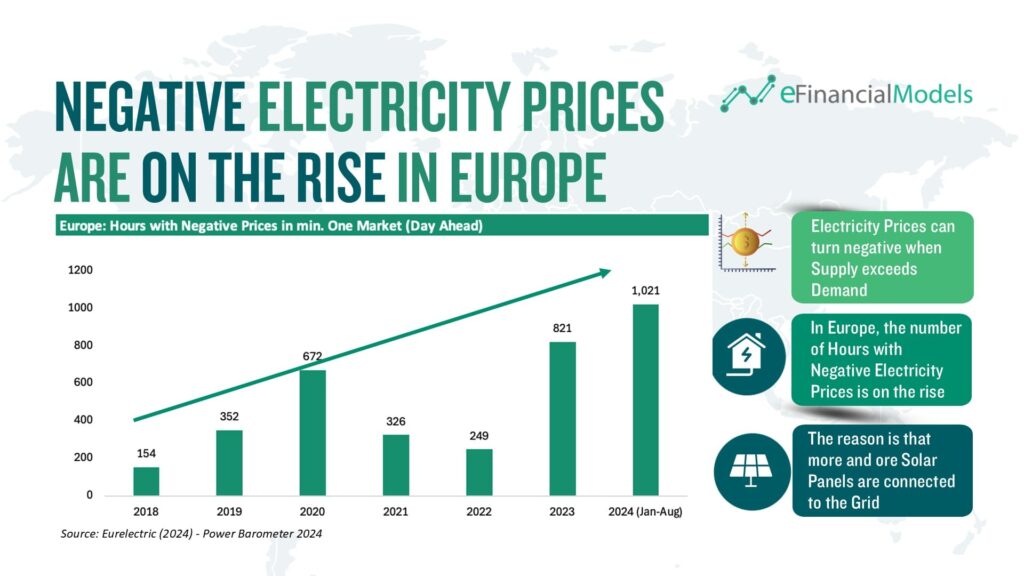
Based on the chart, taken from Eurelectric (2024), it illustrates that the number of hours with negative electricity prices in Europe has risen sharply in recent years. From just 154 hours in 2018, the figure climbed to over 1,021 hours in 2024 (January-August), already surpassing all previous annual totals. This steep increase highlights how the rapid expansion of renewable generation, particularly solar, has intensified midday oversupply periods. As more solar capacity comes online and demand patterns remain relatively stable, these negative-price events are becoming not only more frequent but also a defining feature of Europe’s evolving power market.
A notable example can be observed in Switzerland, where extreme negative-price incidents have been reported. According to TechXplore (2024), the country has recorded very low hourly electricity prices during summer afternoons, sometimes plunging to around €400/MWh, when strong solar output coincides with minimal local demand. These deep negative spikes tend to occur around midday or early afternoon, precisely when solar generation peaks. Such cases underscore how dynamic pricing reflects real-time grid conditions and how solar energy can dramatically reshape market behavior, both economically and operationally. The following section will further examine how electricity pricing patterns differ between weekdays and weekends, and why weekends are especially susceptible to negative pricing events.
Duck Curve: Weekdays vs Weekends
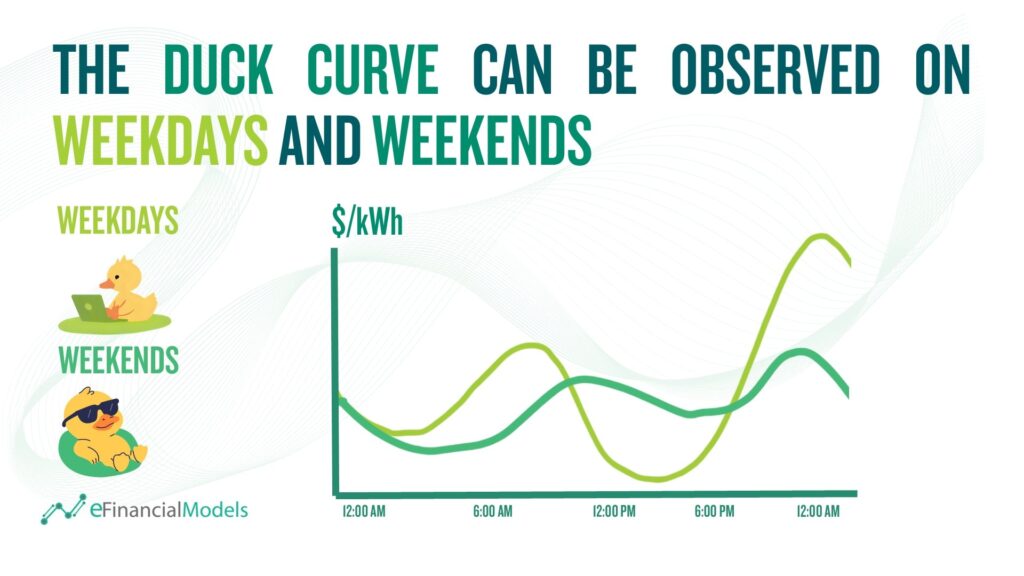
Electricity demand and pricing patterns vary significantly between weekdays and weekends, reflecting differences in human activity and energy consumption behavior. During weekdays, electricity demand tends to be higher and more stable. This is due to the consistent operation of industrial facilities, office buildings, and commercial establishments. This consistent energy use keeps electricity prices relatively stable and helps absorb much of the available generation, including renewable output from solar and wind sources. The result is fewer instances of price dips or negative pricing, as the grid experiences steady consumption throughout most of the day (Aurora, 2020).
On weekends, however, the pattern slightly shifts as demand flattens and then drops as commercial and industrial activities slow down. Many businesses and factories either close or operate at reduced capacity, leading to a noticeable drop in overall demand. At the same time, solar power remains robust during midday hours. This imbalance creates periods of oversupply, where the grid receives more electricity than it needs, causing wholesale prices to drop sharply and occasionally fall below zero. Consequently, weekends are more susceptible to negative pricing events, underscoring the importance of flexible load management, energy storage systems, and dynamic tariffs that can encourage consumers to shift energy use to these low-cost periods.
How Does The Duck Curve Challenge Electricity Grids?
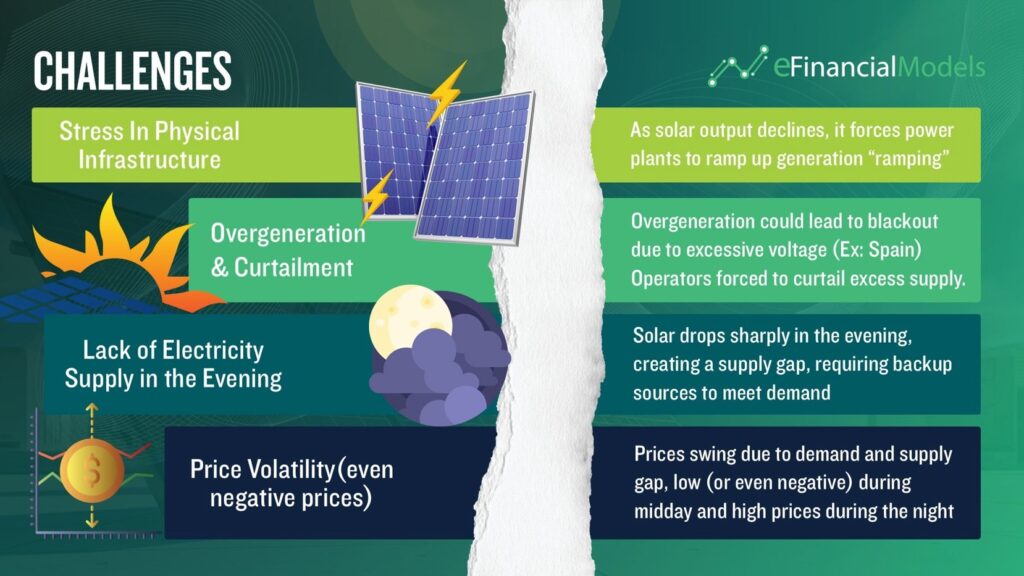
When a grid becomes heavily dependent on solar generation, it faces several significant challenges that affect both system stability and market performance. These challenges will be discussed in greater detail below.
- Stress In Physical Infrastructure
As the sun sets and solar generation drops rapidly, electricity demand typically rises, requiring traditional power plants to quickly increase output to maintain grid stability. This rapid adjustment, known as ramping, places additional pressure on existing infrastructure and challenges the coordination between renewable and conventional sources. Frequent and abrupt changes in generation levels accelerate equipment wear, raise operational costs, and highlight the urgent need for more adaptable systems, such as battery storage and responsive demand technologies, to keep the grid balanced and reliable.
- Overproduction of Electricity during the Day
Around midday, solar-heavy grids often generate more electricity than is needed, leading to overproduction. This surplus can overwhelm grid systems if it can’t be efficiently stored or redirected. A striking example occurred in Spain in April 2025, when the country experienced a widespread blackout linked to an oversupply of renewable energy (NPR, 2025). Solar generation exceeded 50% of total supply, triggering grid instability and temporary outages. The incident underscores that even clean energy can pose risks when production outpaces grid flexibility and storage capacity.
- Lack of electricity supply in the evening
In contrast with the overproduction that happens during midday, the evening tells the opposite story. As the sun sets and solar panels stop generating power, electricity supply quickly drops, just as people start using more energy. Homes light up, appliances run, and businesses are still active, creating a sudden spike in demand that the grid must scramble to meet.
- Negative Prices in Dynamic Pricing
Considering the points mentioned above, electricity prices can fluctuate sharply throughout the day depending on supply and demand conditions, a system known as dynamic pricing. During certain hours, especially when renewable generation exceeds consumption, electricity markets may even experience negative prices, where producers pay to offload surplus power. The next sections will explain dynamic pricing and negative electricity prices in greater detail.
The Demand Surge Behind Modern Grid Challenges
As countries continue to develop and modernize, electricity consumption is rising at an unprecedented pace. The shift toward digitalization, artificial intelligence (AI), and data-driven industries is dramatically increasing energy demand, especially from data centers, which require constant, high-power operation to process and store vast amounts of information.
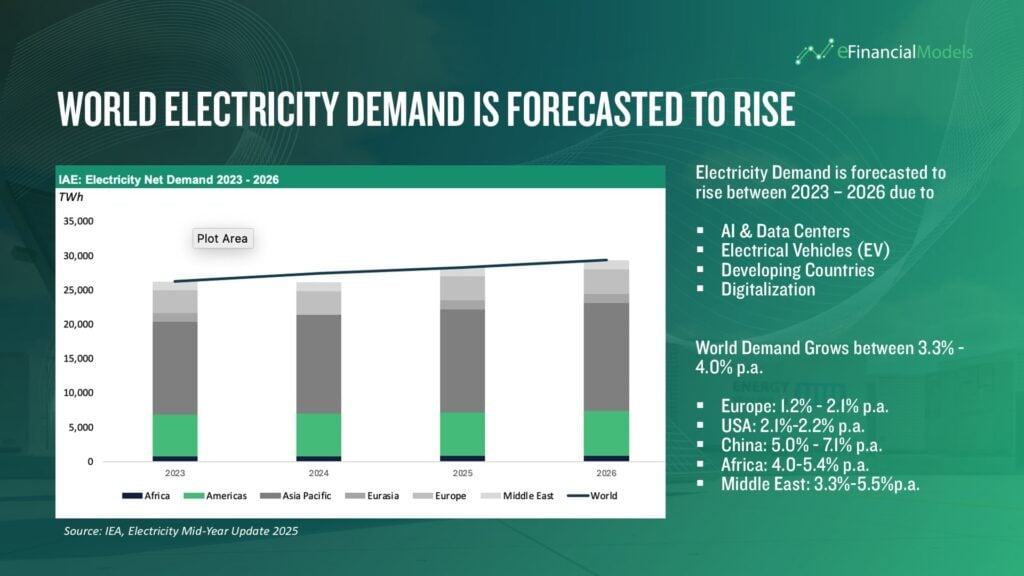
Based on the chart below, global electricity demand continues to rise steadily from 2023 to 2026, with particularly strong growth across the Asia-Pacific and Americas regions. The IEA projects that total global electricity consumption will exceed 30,000 TWh by 2026, reflecting a compound increase driven by industrial expansion, electrification of transport, and accelerating digital transformation.
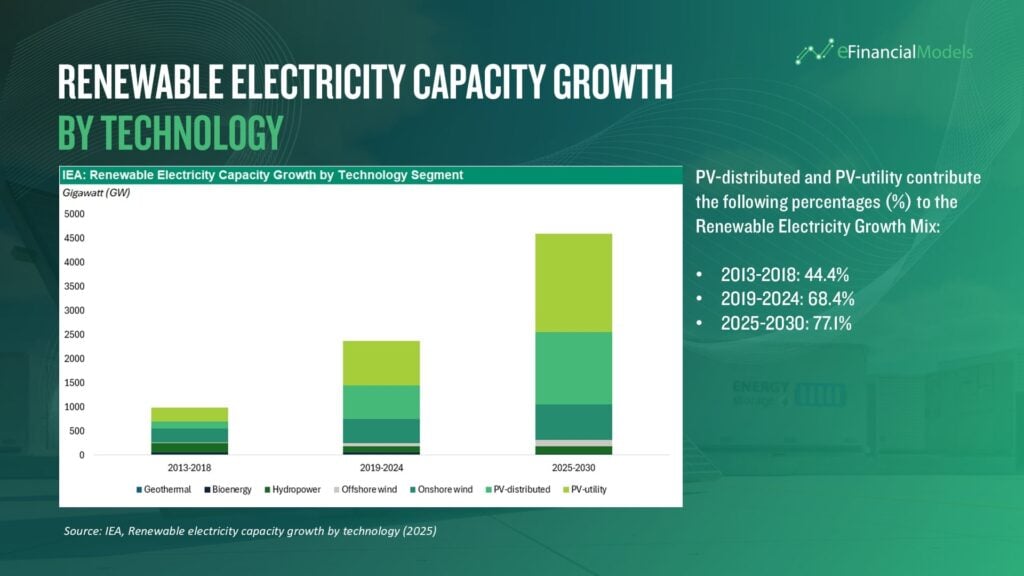
Moreover, projecting the growth in renewable electricity, the bar chart below shows PV-distributed and PV-utility as the emerging dominant contributors of the growth from 44% in 2013-2018, to 68% in 2019-2024, and projected 77% by 2025-2030. This signals a global pivot toward solar technologies. This trend reflects both declining solar costs and policy-driven expansion, underscoring the central role of photovoltaics in future energy planning.
How Rising Solar Capacity Deepens Grid Imbalance?
In recent years, the installation of solar photovoltaic (PV) capacity has accelerated rapidly across the globe. While this marks a significant milestone in the global transition to clean energy, it also intensifies the midday overproduction issue in solar-heavy grids. As more solar panels generate electricity during daylight hours, the gap between supply and demand widens, causing extremely low or even negative prices at noon, followed by sharp price spikes in the evening.
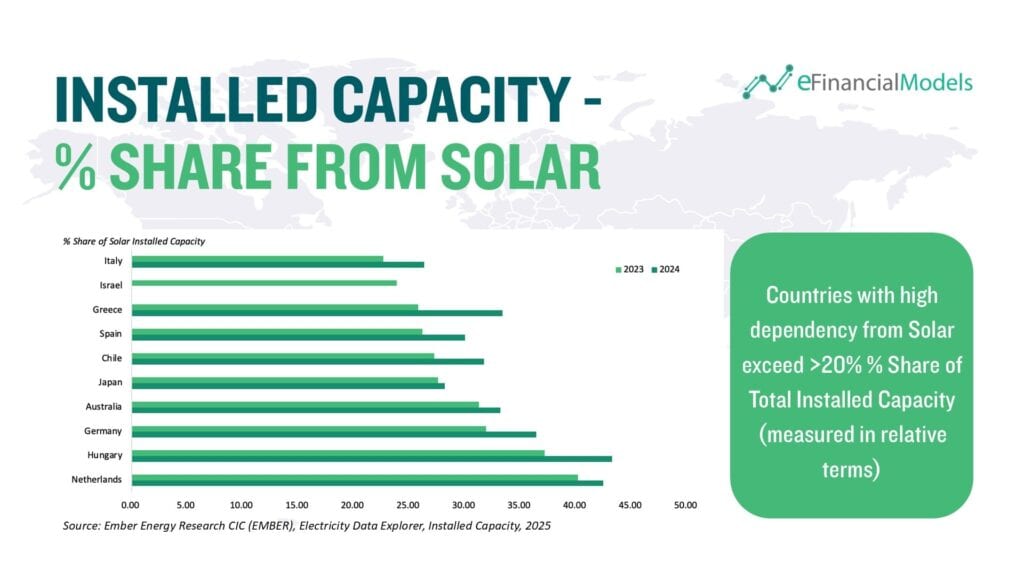
Based on the chart below, the Netherlands, Hungary, and Germany currently lead the world in terms of solar share of total installed electricity capacity, each surpassing 40% in 2024. This rapid solar expansion demonstrates how deeply renewables are being integrated into Europe’s power systems. By contrast, other countries still show smaller solar shares, despite their large-scale renewable potential, highlighting how structural and policy factors shape the pace of transition.
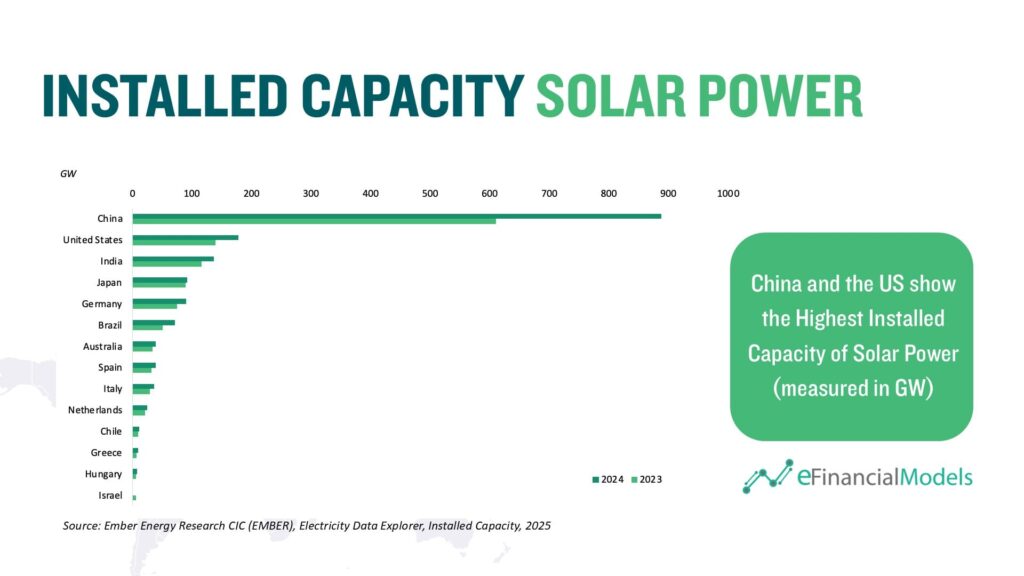
However, when viewed in terms of absolute installed capacity (GW), China dominates the global solar landscape with nearly 1,000 GW of installed capacity, followed by the United States, India, Japan, and Germany. These larger markets benefit from more diversified generation portfolios and flexible interconnections that help manage periods of excess renewable generation. In contrast, smaller European grids with high solar intensity, such as the Netherlands, Spain, and Greece, face sharper challenges in balancing supply and demand, especially during midday hours when solar output peaks.
These pressures became evident in October 2025, when Spain experienced a widespread blackout linked to an oversupply of renewable energy (NPR, 2025). During a period of exceptionally high solar and wind generation combined with mild weather and low consumption, the country’s grid became overloaded, leading to widespread service disruptions and a surge of misinformation about the causes. The incident underscored a growing operational challenge for renewable-heavy systems: when generation exceeds demand and storage capacity is insufficient, grid operators must either curtail production or risk destabilizing voltage fluctuations.
Spain’s experience illustrates the dual nature of rapid solar adoption, accelerating decarbonization and energy independence, but also exposing grids to new reliability risks. As shown by the Ember data, the countries with the highest solar shares are also those most likely to encounter market and operational stress, including negative pricing events and curtailments. The lesson is clear: achieving high renewable penetration must be matched with advanced energy storage, demand flexibility, and real-time market mechanisms to sustain stability as Solar’s role continues to expand across the globe.
This dual-lens perspective, examining both absolute capacity and relative share, is essential when analyzing how solar power reshapes grid behavior. Nations with vast solar fleets, such as China or the United States, often benefit from diversified generation portfolios and flexible backup resources. In contrast, smaller grids with higher solar penetration, such as Spain or the Netherlands, face sharper inflection points between oversupply and shortage, leading to voltage instability, curtailment, or even temporary blackouts. As the share of solar energy continues to climb worldwide, these imbalances will become more pronounced. The next critical question is how grids can effectively manage the volatility between midday oversupply and evening shortfall without compromising reliability or economic efficiency.
What Is Battery Energy Storage System (BESS)?
A Battery Energy Storage System (BESS) is a technological solution that stores electrical energy in batteries for later use, allowing power systems to balance supply and demand more efficiently. It operates by receiving electricity either from the grid, a conventional power station, or renewable energy sources such as solar photovoltaic (PV) systems. During periods of excess generation, typically midday when solar output is high, the system “charges” by storing surplus electricity. Later, when production declines or demand peaks in the evening, it “discharges,” releasing the stored energy back into the grid. This process helps stabilize voltage, prevent power interruptions, and optimize the use of renewable resources. As a result, BESS serves as a critical enabler of modern energy systems, bridging the gap between variable renewable generation and consistent electricity consumption.
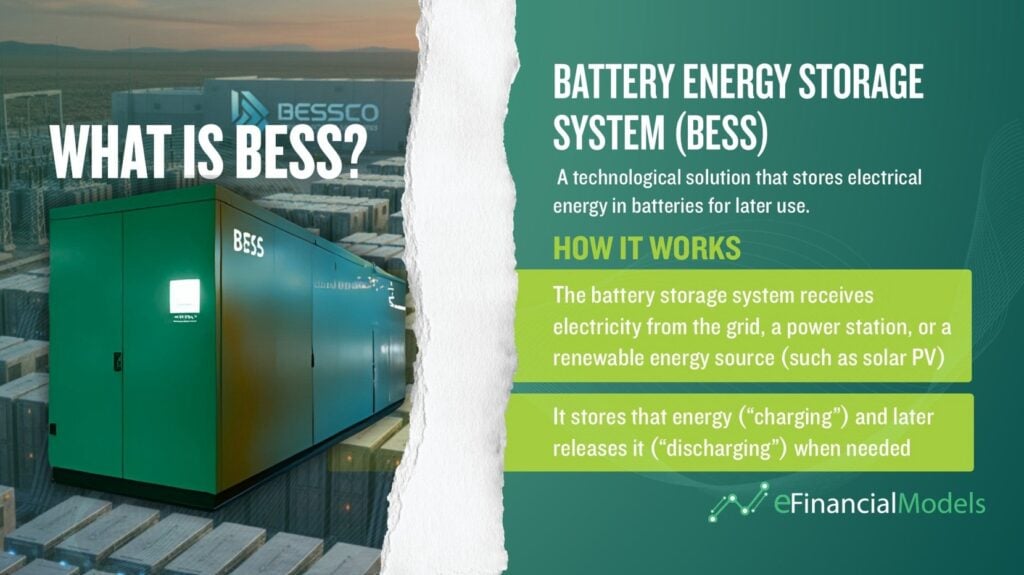
To maintain grid stability and prevent the frequency and price volatility associated with these mismatches, modern energy systems increasingly rely on Battery Energy Storage Systems (BESS). The Battery Energy Storage Systems emerge as a transformative solution, storing excess solar energy during peak generation hours and releasing it when demand surges. The following section explores how BESS technologies are being deployed to stabilize solar-heavy grids and enable a more resilient, balanced, and sustainable energy future.
Take Advantage Of The Duck Curve With A Battery Energy Storage System (BESS)
To overcome the twin challenges of solar overgeneration and grid flexibility, Battery Energy Storage Systems (BESS) have become a central pillar of modern energy management. These systems store excess electricity, often produced during periods of high solar output, and release it back to the grid when demand rises.
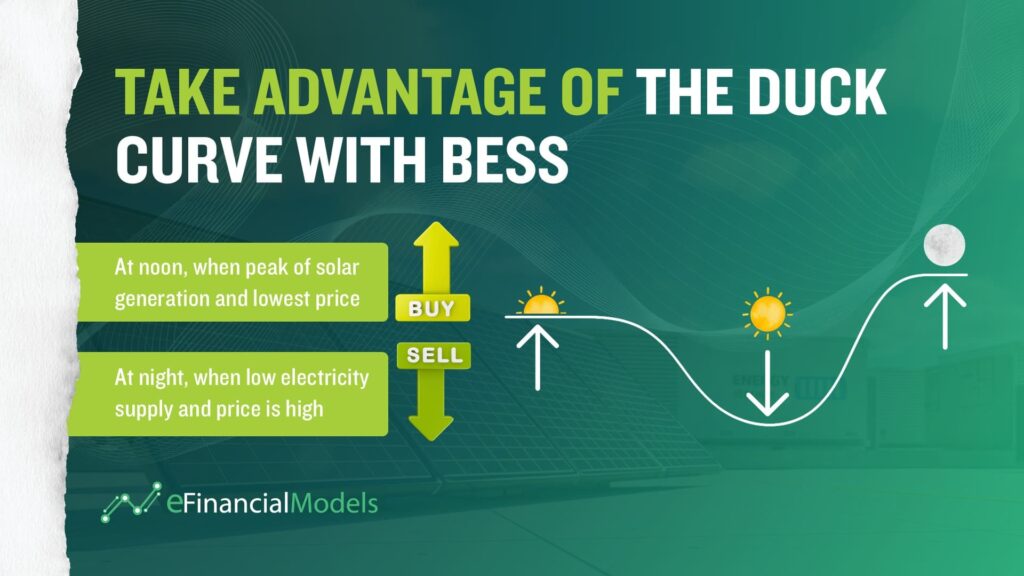
In relation to the Duck Curve, BESS plays a vital balancing role. During midday, when solar power floods the grid and prices drop due to oversupply, storage units absorb the surplus electricity at minimal cost. Later, as evening demand surges and prices rise, they discharge that stored energy, supplying power precisely when it is most needed.
This cycle not only stabilizes the grid but also transforms market volatility into a financial advantage for operators. By capturing energy when it’s abundant and releasing it when it’s scarce, BESS turns daily fluctuations into an opportunity for both energy arbitrage and system reliability. At its core, the strategy hinges on two critical operational phases:
- The Midday Dip (The Belly): This phase occurs when sunlight is strongest, typically between 11:00 AM and 3:00 PM. During this window, solar generation often exceeds total demand, flooding the grid with low-cost electricity. To prevent overload, grid operators may be forced to curtail (or switch off) some solar output. As a result, wholesale prices can plunge toward zero or even turn negative. This makes midday the ideal time for battery energy storage systems (BESS) to charge, capturing surplus renewable energy that would otherwise be wasted.
- The Evening Spike (The Neck): The critical challenge emerges between 5:00 PM and 9:00 PM, when solar production rapidly declines just as residential demand peaks. People return home, switch on appliances, and energy consumption surges. With solar power fading, the grid must quickly ramp up supply from other sources, often relying on costly gas or hydro plants. This steep “ramp-up” drives prices to their highest point of the day, creating the perfect opportunity for batteries to discharge stored energy, stabilizing the grid while capitalizing on elevated market prices.
This predictable pattern of the Duck Curve is not just a technical challenge, it is a guaranteed financial opportunity. It provides daily windows of ultra-low prices for charging and high prices for selling, allowing operators to maximize arbitrage value while supporting grid reliability.
Prepare for the Solar + BESS Opportunity
To fully leverage this shift, now is the time to integrate battery storage into your solar strategy. Whether you are modeling project economics or evaluating investment potential, our ready-to-use Solar + Battery Energy Storage System (BESS) Financial Model can help you assess arbitrage value, optimize system sizing, and project long-term returns with confidence.
Download our specialized Solar + BESS Financial Model today to begin planning your profitable solar project and unlock the full potential of the Duck Curve.
Future Challenges For Electricity Grids
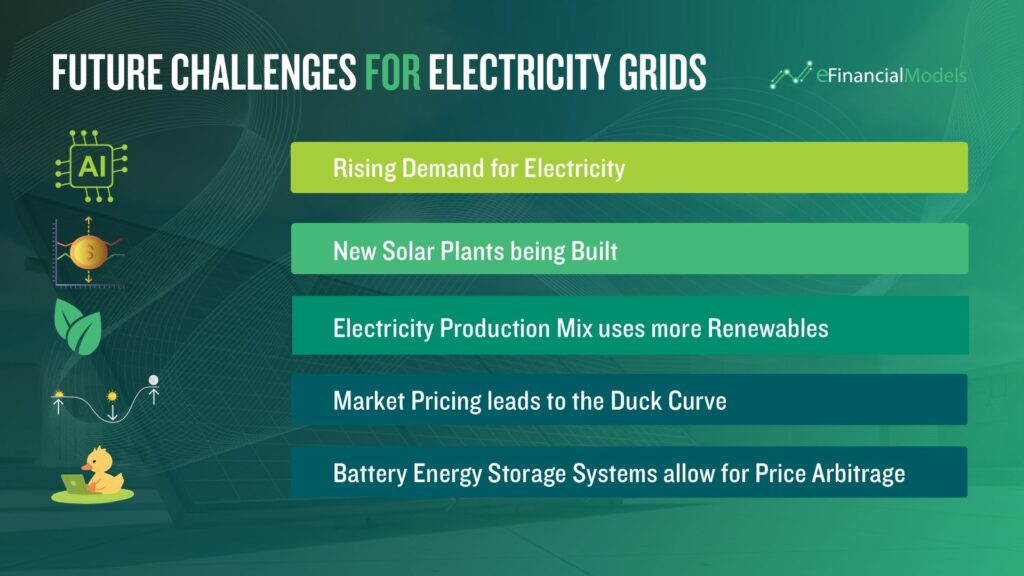
As global energy systems transition toward cleaner, smarter, and more decentralized models, electricity grids are facing a new era of complexity. The traditional one-way flow of power is being replaced by dynamic, bidirectional networks shaped by solar expansion, digital demand, and market volatility. These shifts are not just technical, they’re economic, behavioral, and infrastructural. The following are five (5) key pressure points that utilities, regulators, and consumers must navigate to ensure reliability, affordability, and sustainability in the years ahead:
- Rising Demand for Electricity
AI workloads, hyperscale data centers, electric vehicles, and digitalization are driving exponential growth in electricity consumption. This surge is outpacing traditional grid planning cycles and placing immense pressure on aging infrastructure. Without strategic upgrades and smarter energy management, reliability risks increase across both urban and rural networks. Meeting this demand requires investment in grid modernization, demand response programs, and energy efficiency technologies.
- New Solar Plants Being Built
The global push for decarbonization is accelerating the construction of solar power plants across regions. While this supports climate goals and reduces fossil fuel dependency, solar generation is inherently intermittent—peaking midday and dropping off by evening. These fluctuations complicate grid balancing and can lead to oversupply or shortages within hours. To maintain stability, operators must deploy advanced forecasting tools, flexible dispatch strategies, and scalable energy storage.
- Electricity Production Mix Uses More Renewables
As renewables like wind and solar become dominant in the generation mix, the grid must evolve to handle variable and weather-dependent output. Traditional baseload systems designed for steady fossil fuel generation struggle to accommodate these fluctuations. This shift demands real-time responsiveness, dynamic balancing mechanisms, and digital grid intelligence. It also requires rethinking market structures to reward flexibility and resilience.
- Market Pricing Leads to the Duck Curve
The Duck Curve visually illustrates how solar-heavy grids distort electricity pricing, cheap power at midday, expensive peaks in the evening. First introduced by CAISO, it highlights the mismatch between solar production and consumer demand over a 24-hour cycle. As solar surpluses depress prices and evening ramps drive them up, volatility becomes a daily norm. This pricing instability challenges grid operators and underscores the need for flexible consumption and smarter market signals.
- Battery Energy Storage Enables Price Arbitrage
Battery Energy Storage Systems (BESS) allow users to capitalize on price swings by charging during low-cost solar surpluses and discharging during high-cost evening peaks. This arbitrage helps flatten the Duck Curve and reduces strain on the grid during critical hours. Storage also enhances resilience by providing backup power and supporting frequency regulation. As dynamic pricing becomes more widespread, BESS will play a central role in enabling consumer participation and grid flexibility.
Conclusion
The Duck Curve is more than just a graphical representation of grid imbalance, it embodies the evolving dynamics of electricity markets in the era of widespread solar adoption. As solar generation grows, predictable periods of midday oversupply and steep evening demand create both operational challenges and financial opportunities. What was once considered a technical hurdle has now become a consistent opportunity for strategic energy management.
By integrating Solar + Battery Energy Storage Systems (BESS), energy producers and investors can harness these daily fluctuations to their advantage. Charging batteries during low-cost, high-solar periods and discharging during evening peaks not only supports grid stability but also unlocks revenue through energy arbitrage and participation in ancillary services markets. BESS effectively bridges the gap between variable renewable generation and consistent electricity demand, transforming volatility into value.
Understanding and modeling the Duck Curve is no longer optional, it is essential for optimizing project economics, dispatch schedules, and long-term returns in renewable energy systems. With the right tools, including a Solar + BESS Financial Model, stakeholders can simulate storage integration, flatten peak demand, maximize profitability, and enhance grid reliability. The Duck Curve isn’t just a challenge, it’s an opportunity. Take advantage of it today by leveraging BESS and strategic energy planning.
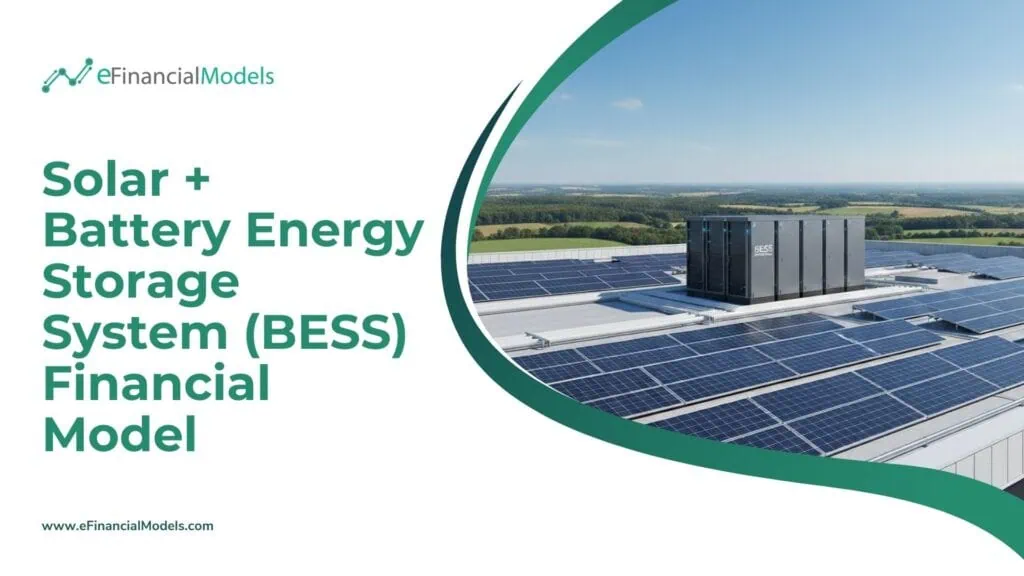
Download our Solar + Battery Energy Storage System (BESS) Financial Model to simulate storage integration, optimize profitability, and enhance grid reliability.



Frequently Asked Questions (FAQ):
As the Duck Curve and Battery Energy Storage Systems (BESS) continue to reshape modern electricity markets, readers often raise deeper questions about the challenges, technologies, and financial realities behind grid flexibility. Below are answers to some of the most common questions that expand on key themes discussed in this article.
- What defines a “solar-heavy” electricity grid?
A solar-heavy grid is one where photovoltaic (PV) systems contribute a significant share of total electricity generation, often exceeding 30–40% of daily supply. These grids typically experience pronounced midday oversupply and steep evening demand spikes, forming the so-called Duck Curve. Managing such systems requires flexible energy storage, advanced forecasting, and responsive demand management to maintain grid stability as solar adoption rises.
- What technologies besides lithium-ion batteries can address the Duck Curve?
Other technologies such as flow batteries, flywheels, and demand response systems can help manage the Duck Curve by balancing short-term supply and demand. Flow batteries offer long lifespans and flexibility, while flywheels provide instant response for grid stability. Demand response programs shift energy use away from peak hours to reduce strain. Though effective, these solutions remain costly to deploy at scale, with high upfront investment and infrastructure requirements limiting their widespread adoption.
- How do we handle seasonal imbalances that daily batteries can’t cover?
Long-duration energy storage technologies such as green hydrogen, pumped hydro, and thermal storage can retain energy for weeks or even months, helping bridge the seasonal gap between high summer production and low winter output. These systems enable renewable power to be used long after it’s generated, supporting grid reliability year-round. Yet, their large-scale deployment is expensive, requiring significant infrastructure, land, and capital investment, which currently limits how widely they can be implemented.
- Is energy arbitrage enough to make BESS profitable?
Energy arbitrage alone is typically insufficient to ensure the profitability of Battery Energy Storage System (BESS) projects. While storing low-cost power and selling it during high-demand periods provides a steady income stream, the high upfront and operational costs of BESS require additional sources of revenue. Profitability is strengthened when systems also provide ancillary services, capacity payments, and grid-balancing support, creating a more stable and diversified financial model.
- How does battery degradation affect profitability?
Battery degradation gradually reduces storage capacity with each charge and discharge cycle, which can increase maintenance costs and shorten system lifespan. This decline directly impacts profitability over time, as energy output and efficiency drop. Implementing optimized dispatch strategies, such as avoiding unnecessary deep cycles and prioritizing partial charging, helps extend battery life, preserve performance, and sustain financial returns across the asset’s lifetime.
- What role does grid digitalization play in managing solar variability?
Grid digitalization, through real-time data analytics, smart meters, and AI forecasting, enables operators to anticipate demand shifts and solar fluctuations more accurately. This enhances grid flexibility by optimizing dispatch decisions and preventing overgeneration. Although digital infrastructure demands upfront investment, it significantly improves reliability and reduces the risk of costly imbalances in renewable-heavy systems.
- How do policy incentives affect the adoption of BESS?
Government incentives, such as tax credits, feed-in tariffs, and capacity market payments, play a critical role in accelerating BESS deployment. These policies help offset high capital costs and encourage private sector investment. Without such support, adoption tends to lag, as market revenues alone are often insufficient to cover installation and operational expenses in early-stage markets.
- What are the environmental impacts of large-scale battery deployment?
While BESS supports renewable integration, it also raises concerns over raw material sourcing, recycling, and end-of-life disposal. Mining lithium, cobalt, and nickel can have environmental and ethical implications. To mitigate these, industry efforts are shifting toward circular economy approaches, such as second-life battery use, material recovery, and cleaner production methods, to reduce lifecycle emissions and waste.
- How can future innovations make energy storage more affordable?
Emerging technologies like sodium-ion, solid-state batteries, and hybrid storage systems aim to reduce costs and enhance safety while extending lifespan. Advances in materials science and manufacturing efficiency are steadily driving down prices. As economies of scale grow and supply chains mature, these innovations are expected to make grid-scale storage more economically viable, accelerating the global transition to renewable energy.
- How does increasing renewable penetration affect grid reliability?
As renewable energy sources like solar and wind become dominant, the grid must adapt to greater variability and less predictable power flows. Unlike conventional plants that provide steady output, renewables fluctuate with weather and daylight, making real-time balancing more complex. This shift requires enhanced grid flexibility, faster response technologies like BESS, and stronger interconnection between regions to ensure reliable electricity even during periods of low generation.

Tags: Battery Energy Storage System (BESS), Duck Curve, Dynamic Pricing, Electricity Pricing, financial planning, Investment Analysis, Negative Prices, Solar Electricity Grids, Solar-Heavy Electricity Grids