What is Break-Even Analysis?

Before your business can realize “profit,” you must first understand the concept of breaking even. To break even on your company’s product lines and/or services, you must be able to calculate the sales volume needed to cover your costs and how to use this information to your advantage. You must also be familiar with how your costs react to changes in volume. These two elements will help you in determining at what point your business will be profitable.
Break-Even Analysis
This is the process of calculating the sales needed to cover your costs so that there is zero profit or loss. You will achieve break-even when your total sales or revenues equal your total expenses. The break-even point that is arrived at is important to the profit planning process. Basically, conducting a Break-Even Analysis in Excel helps determine when you can expect your business to cover all expenses and start generating profit.
Such knowledge allows managers to maintain and improve operating results. This will help you set specific revenue goals for your business. When you have a clear number in mind, it will be much easier to strategize and make business decisions. It is also important when introducing a new product or service, modernizing facilities, starting a new business, or appraising production and administrative activities.
Creating a Break-even analysis spreadsheet can also be used as a screening device, such as the first attempt to determine the economic feasibility of an investment proposal. Also, pricing may be aided by knowing the break-even point for a product.
The guidelines for breaking even are:
- If there’s an increase in selling price, it lowers break-even sales
- If there’s an increase in variable cost, it increases break-even sales
- If there’s an increase in fixed cost, it increases break-even sales
Break-even analysis (cost-volume-profit analysis or CVP) allows you to answer many planning questions and help with decision-making. Moreover, it will help you avoid failures and limit the financial toll of poorly-made decisions affecting your business. Instead, you can be realistic about the potential outcomes.
Important Concepts for Break-Even Analysis
In order to understand the Break-Even Analysis better, below we enumerated some of the most important concepts you need to know in order to effectively and correctly do a Break-Even Analysis.
(1) Categorize your costs between Fixed and Variable Costs – before everyone starts doing a break-even analysis, you should first prepare and categorize your costs into these two important elements. You need to decide which of your costs are Fixed and Variable. Not only this is important for doing a Break-Even analysis but also this can have a great impact on the ongoing results of your analysis.
(2) Fixed Costs – is one type of cost incurred by you. Unlike the variable cost, the fixed cost for a business does not vary with the output amount. Even if no products or services are made, it remains the same, and so can not be stopped. Here you need to determine which of your cost would take part in your Fixed Cost. Obviously these fixed costs depend on the business year, or the year you wish to work on your Break-Even Analysis.
(3) Variable Costs – is a company’s cost that is associated with the number of goods or services it produces. A company’s variable cost increases and decreases depending on how you are going to use it. Below are the two types of variable costs:
- As a percentage of revenues, e.g. 3.5% fees for PayPal payment gateway. This is the company’s variable production costs as a percentage of its net sales. Here the sales price affects the variable costs because any changes in the price affect the revenue, therefore as a percentage of sales, the variable cost will also be affected.
- As a cost per unit of sales volume, for instance, transportation costs for oil normally estimated at a cost per barrel, so the order price can go up and down. Meaning, when production volume goes up, the variable costs will increase. On the other hand, if the volume goes down, so too will the variable costs.
(4) Break-Even Point – is the required volume at which revenues cover all the costs and profits are exactly zero. In connection with this, we have different definitions of profits. It can be at EBITDA Level, EBIT Level, Net Income Level, or even Free Cash flow Level depending on your definition of profits for break-even analysis on your business.
(5) Volume – you also need to specify what volumes you are referring to as this could be referred to as sales volumes, production volumes, subscribers, kilograms, sales units, there are many ways you can define volumes and this should be specified.
(6) Time Period – every break-even analysis refers to a specific time period which can either be per month, week, day, and year. Important is to specify the time which your break-even analysis refers to in order to prevent confusion or miscalculations.
(7) Time to Break-Even – after successfully creating a break-even analysis on your website, now you’ll be able to determine at which point in time (month or year) your business is going to break-even, or when to earn a profit.
(8) Risk – remember that break-even analysis is also always a risk analysis. Now decide which business would you like to own? A business that requires 20 units of sales to achieve break-even or 100 units of sales to achieve break-even (assuming everything else is the same)? Answer: Obviously the business which requires to sell only 20 units. Why? It has less risk against a business that requires you to sell 100 units. So break-even analysis helps you to identify your business risk and can lead you to ask the right questions if it has to be a fixed cost or to better be transformed into variable costs.
How to Calculate the required Volumes to achieve Break-Even?
A company’s break-even analysis excel formula in volume units is as follows:
(total fixed costs) / (contribution margin per unit)
As the fixed costs change for each accounting, period, the required volumes to achieve break-even will also change. The breakeven points that are shown for each accounting period apply to each accounting period separately; they are not cumulative in nature. It also varies across accounting periods due to the fluctuation in fixed costs, variable costs, and revenues over each of the accounting periods. Below is an example calculation of the Breakeven Point in Volume Units.
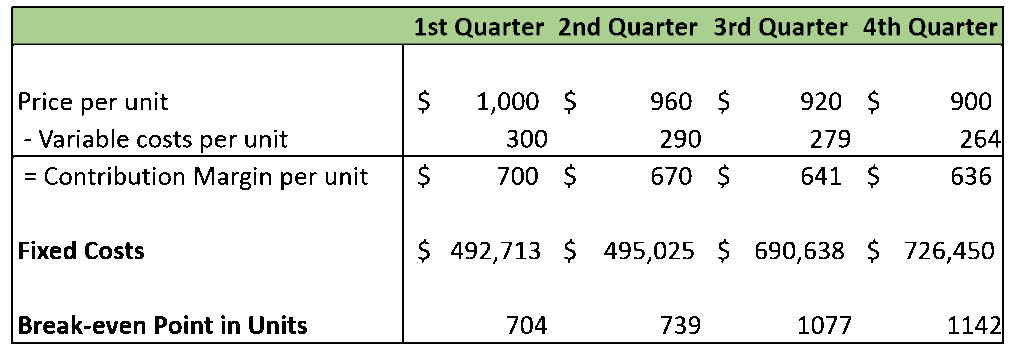
The calculation is as follows:

Where:
- Q = Quarter;
- VarCosts = Variable Costs;
- VCperUnit = Variable Costs per Unit;
- CMPU = Contribution Margin per Unit
Meaning, for the 1st Quarter, we would need to sell 704 units in order to cover your fixed costs. To show you the answer in a graph form, we have:

Additionally, the break-even analysis graph in excel is a simple tool that determines the lowest quantity of sales which can cover both your variable and fixed costs. The results facilitate the decision-makers with a number that can be used to evaluate future demand. You can use this info for taking product decisions such as discontinuing the product, or improving advertising strategies, or repricing the product to increase demand and many others.
You can also determine the break-even point by using a graphic table such as the following:

Using the graphic shown above, the revenue, total cost, and fixed cost are plotted on a vertical axis and volume is plotted on a horizontal axis. The break-even point occurs at the intersection of the revenue line and the total cost line. It also depicts profit potentials over a wide range of activities. Basically, it shows how profits increase with increases in volume.
Benefits of Break-Even Analysis in Excel
Analyzing break-even is a very critical and valuable tool for financial reporting and control. One of its great qualities is the simplicity of these charts and graphs. Since they are simple to understand, they are a useful tool to show the top management the problems inherent in the relationships between cost-volume- benefit. They are extremely useful in system planning.
So below are some benefits of doing Break-Even Analysis for your business:
- Business Risk – Break-even analysis template helps to assess the impact if there is a sales downturn in the business. It is highly useful for taking valuable decisions by management. You can now able to transform identified fixed costs into variable costs, therefore reducing business risk. Break-even analysis can help you in the overall financial decision making when it comes to how to build your business model.
- Pricing Strategy – Selling price is an important factor when doing a break-even analysis. By doing so, you will be able to see the possible adjustments in selling price has on the overall profitability. Hence, this tool provides more information for the managers to make better pricing decisions and therefore helps to optimize the pricing strategy.
- Budgeting and Setting Targets – Doing break-even analysis in Excel is much helpful for budgeting procedures. Since the business knows exactly how many are needed to be sold in order to break-even, they are now aware of the profits the company will be able to earn at various points. This can help businesses set realistic, achievable budget goals and targets of themselves.
- New Products – By adding a new product, you may also need to consider the added costs and incorporate them into the pricing of the new product. In the case of an existing business, doing a break-even analysis is still important before launching a new product, especially if that new product bears a significant expenditure.
- Capacity Utilization – Break-even analysis helps you to determine untapped production capacities you actually have. It leads you to the right questions on how to utilize your production capacities better.
- Production Automation – Break-even analysis can help you to assess the impact of changing from manual production to automated production processes. Therefore, it can offer a valid argument that by spending money on automation equipment, the break-even point can be reduced.
Excel Template with Break Even Analysis Spreadsheet
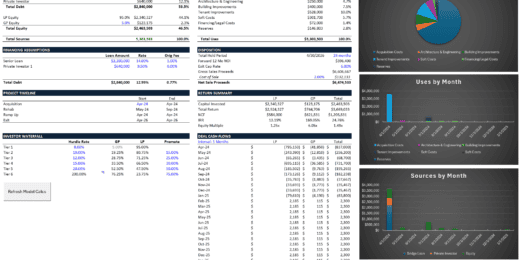
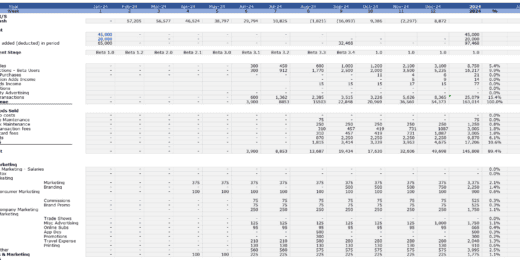
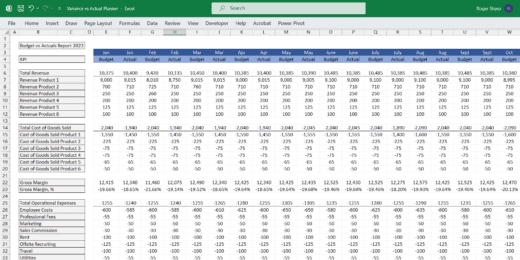
By simply adding a break-even analysis excel template for your project or business, you will be able to evaluate its feasibility and monitor when it becomes profitable or able to at least cover the costs expended. Basically, it is a very useful tool as a metric to calculate the level of fixed costs relative to the profit earned by your business or project.
But of course, to conduct a break-even analysis, one would need to put it down in a presentable report so that you can use it in the future for potential investors. The best way to represent it is by building a financial model that includes the calculation of the break-even point.
Here are some benefits of using a Break Even Analysis Spreadsheet:
- Using an excellent Break Even Analysis Spreadsheet allows you to do more flexible calculations with guaranteed effective results that you can use on your business decision making.
- Break-Even Analysis Spreadsheet can also be a part of various Financial Models that could help you a lot in determining your financial capabilities and making economic decisions.
- You need to make sure that the figures you are going to use in your analysis are consistent with your other planning assumptions so reflect correct results.
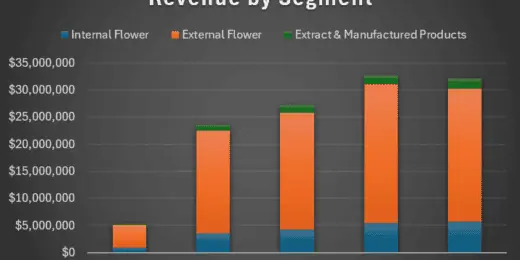
- Using an excellent Break Even Analysis Spreadsheet allows you to visualize the result in forms of graphs and charts and many others!
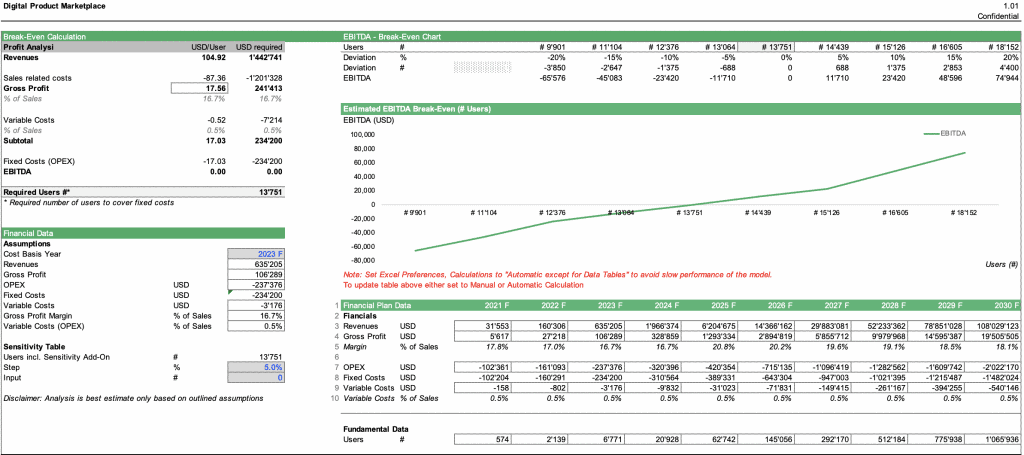
Source: Digital Product Marketplace Model
Conclusion: Start using the Break-Even Analysis Template today!
In conclusion, break-even analysis in Excel is a must-have method to use when assessing the business’ feasibility and goals, as it helps to determine the risk and define methods for reducing such risk. Performing a daily break-even analysis excel template will add to your ability to make financial decisions for your company as you move forward.
Are you looking for a financial model that includes the calculation of when you can reach break-even? If you are, then you can simply use a break-even analysis calculator. It comes in a form of break-even analysis Excel template which you can use as a reference or a base of your own financial model. The template contains break-even analysis spreadsheets that are ready-made by financial modeling experts for any kind of user. The break-even analysis calculator is actually a part of a full working model to help determine the break-even point of a business or company.
You can download these break-even analysis spreadsheets or break-even analysis Excel templates here: Financial Models with Break-Even Analysis. There, you can also find several financial model templates for different use cases and industry-specific at eFinancialModels which consists of financial modeling experts with vast experience and substantial know-how. The spreadsheet templates are also available for download anytime and anywhere on the globe such as USA, Canada, Mexico, Germany, Italy, Japan, United Kingdom, Australia, New Zealand, and many more countries.


