
0 ITEMS

Solar Park Valuation Case Study

Key Takeaways
- A developer needed a fair market valuation of a utility-scale solar park for a tax authority.
- What mattered most: remaining PPA years, the PPA price and a market discount rate.
- Turning point: fair value is a function of remaining life, so a multiple cannot replace a DCF.
- Outcome: a DCF valuation to the end of the lifetime, PPA and post-PPA years shown separately, and a report.
PDF0.8 MB
Free download · No email required
Download the Solar Park Valuation Financial Model Case Study
✓ Model structure✓ Key assumptions✓ Results and takeaways
A tax authority, a lender and a buyer ask the same questions of an operating solar park. What is it worth today? What return does that value imply? How much is still contracted? Every input needs a reason. A valuation is only as strong as its weakest explained input. Showing the value next to the discount rate and remaining life shows which assumption carries the result.
The Client and the Decision
The client is a project developer that built a utility-scale solar park. The park sells its electricity to a utility company under a long-term power purchase agreement (PPA) with a fixed price. A tax authority made a request, and the answer needed a professional fair market valuation. The hardest question to expect is a simple one: why this value, and not a multiple of today’s earnings?
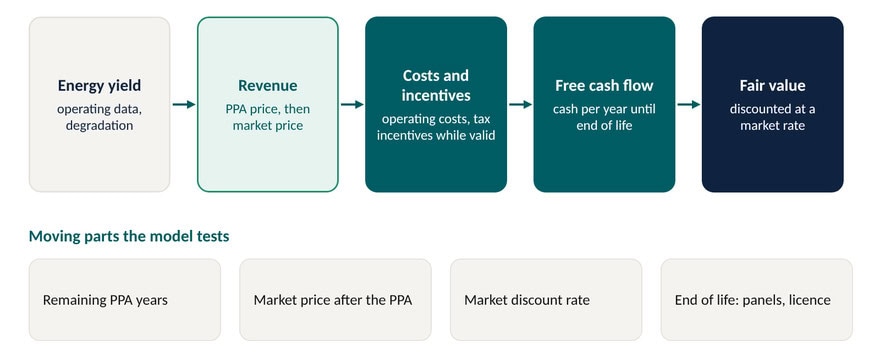
How a DCF values a solar park. A discounted cash flow (DCF) valuation adds up the free cash the park can still generate until the end of its life and discounts it for risk. The yield sets the electricity sold, the PPA price and later the market price turn it into revenue, and operating costs and tax incentives give the free cash flow.
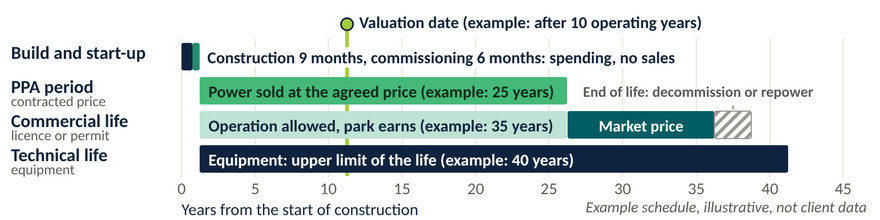
The lifetime of a solar park on one timeline. Every valuation sits inside the park’s schedule, and each period earns differently. These periods belong to the asset; the model has to place the valuation date inside them.
- Construction (9 months): money is spent, nothing is sold.
- Commissioning (6 months): the park is connected and tested before regular operation.
- PPA period (for example 25 years): the contract sells the power at an agreed price, so revenue is contracted.
- Commercial and technical life: the licence or permit sets how long the park may operate commercially, and the park earns until it ends. The equipment sets the technical limit, the upper bound of the life.
- End of life, after the commercial life: the park is decommissioned, or repowered with new panels and a renewed licence.
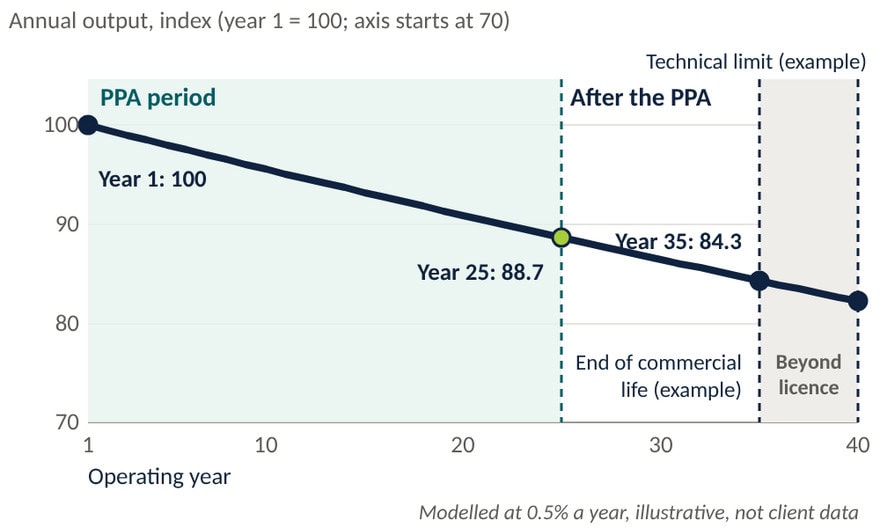
Expected solar output: highest in year 1. The model assumes that panels age: output is highest in the first operating year and a little lower every year after. It reduces output by 0.5% a year. That is a modelling assumption, checked against the park’s own yield data. Over the 25 PPA years of the example, output falls to about 89% of year 1. Running costs do not fall in step, so free cash flow falls faster than revenue. In the illustration, ageing lowers the value by about 5% compared with flat output.
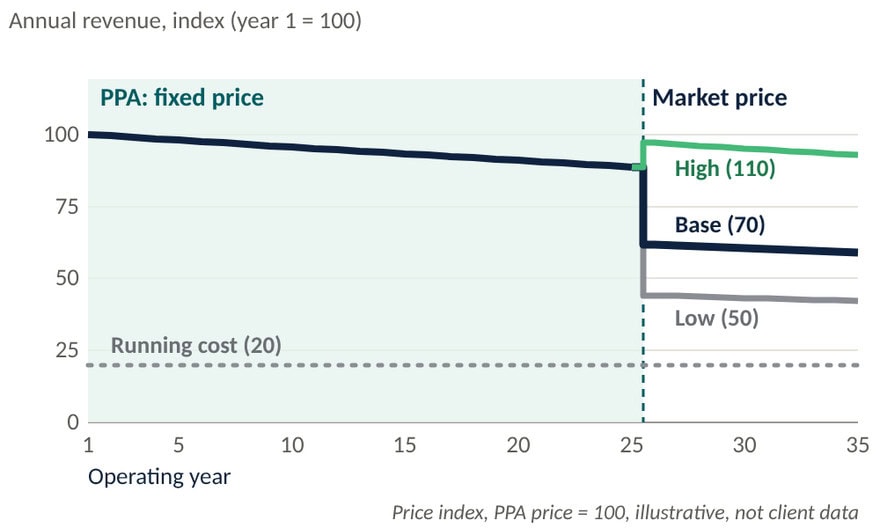
After the PPA: market prices, shown separately. When the PPA ends, the park can still sell electricity. The model needs an explicit assumption for these years: the power is sold on the wholesale market at a forecast price. We use a low, base and high price path, set as an index to the PPA price (100), and deduct the running cost of the park (index 20). The price can be lower or higher than the PPA price. The valuation shows PPA years and post-PPA years separately. A buyer then sees how much of the value rests on the contract and how much on market prices.
Scenario table with fictional index values, 8% discount rate
| Scenario | Market price (PPA = 100) | First post-PPA revenue | Value: PPA years | Value: post-PPA years | Rests on market prices |
| Low | 50 | 44 | 621 | 49 | 7% |
| Base | 70 | 62 | 621 | 86 | 12% |
| High | 110 | 97 | 621 | 159 | 20% |
Why This Was Hard to Model
- A valuation for a tax authority. A tax authority expects a fair market value, not the view of a buyer who wants a low price or a seller who wants a high one. How we solved it: We set each parameter as an independent party would, so the value can be explained line by line.
- A long-term fixed price and a value that shrinks with age. The PPA terms and the remaining years decide most of the revenue, and every year removes one earning year. How we solved it: We built revenue from the fixed price for the remaining PPA years and the park’s yields, and modelled the free cash flows year by year to the end of the lifetime.
- A market discount rate. There is no single correct rate. It must reflect the risk of the asset and the opportunity cost of the capital. How we solved it: We analysed country and project risks and estimated a market discount rate.
- Yields, costs and tax incentives need evidence. A forecast over the full lifetime is only as good as its evidence, and tax incentives are valid for a limited number of years. How we solved it: The park had several years of operating data. We compared yields to substantiate the forecast, used the park’s own cost data to support the cost estimate, and counted incentives only while valid.
The Turning Point: Value Is a Function of Remaining Life
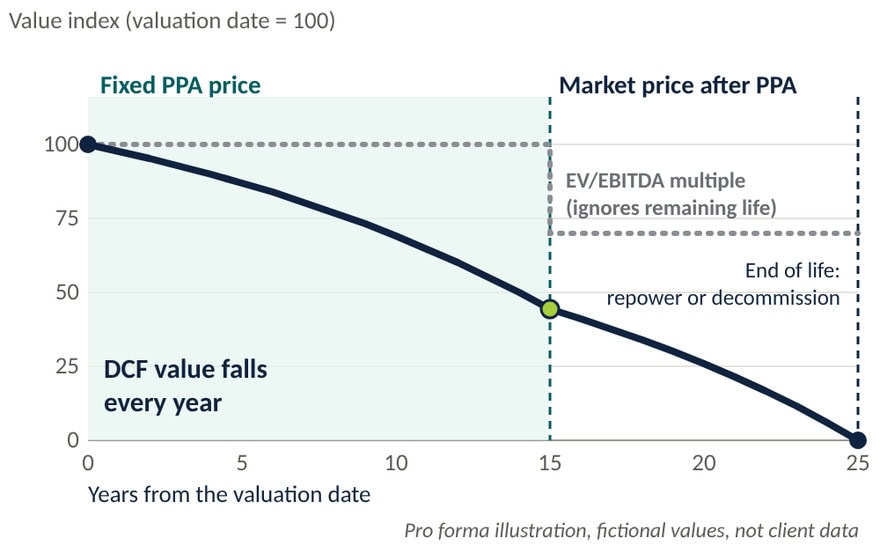
The key insight for the tax authority’s question was that the fair value of a solar park depends on its remaining life. Each year removes one operating year, so the DCF value falls every year. In the illustration, the slope changes when the PPA price gives way to a market price, and the value reaches about zero at the end of life. An EV/EBITDA multiple (enterprise value divided by EBITDA, earnings before interest, tax, depreciation and amortisation) looks at current earnings and does not know whether the park has 20 years left or five.
What Drives the Value
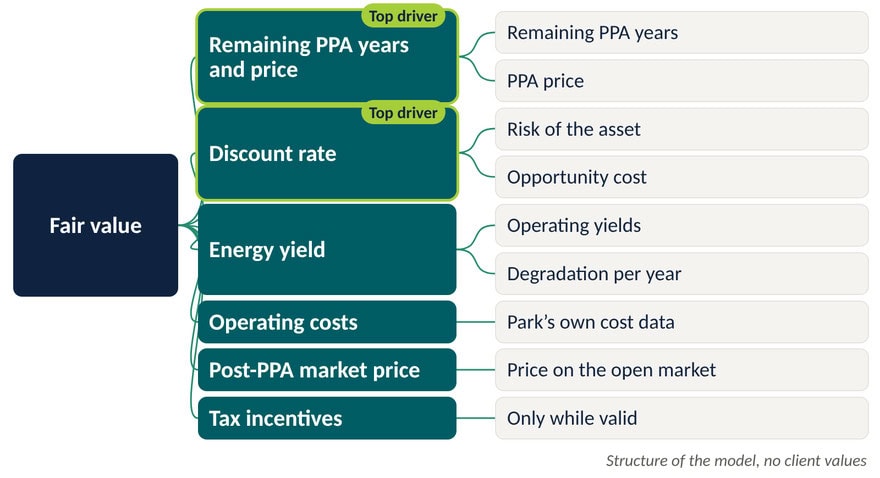
Two drivers matter most: the remaining PPA years with the PPA price, and the discount rate. Yield and ageing, operating costs, the post-PPA price and tax incentives follow.
Three fictional parks earn the same free cash flow. We value them with a multiple and with a DCF at two discount rates.
Worked example with fictional numbers: same earnings, different remaining life
| Item | Park A | Park B | Park C |
| Remaining life | 20 years | 10 years | 5 years |
| EBITDA = free cash flow (simplified, flat) | 100 per year | 100 per year | 100 per year |
| Value at 8 times EBITDA | 800 | 800 | 800 |
| DCF value at 8% (annuity factor) | 982 (9.82) | 671 (6.71) | 399 (3.99) |
| DCF value at 10% (annuity factor) | 851 (8.51) | 614 (6.14) | 379 (3.79) |
| DCF value at 8% as share of the multiple value | 123% | 84% | 50% |
The multiple values all three parks alike. The DCF counts only the years that are left.
How We Worked Together and the Result
How we worked together. We analysed the data of the park and the terms of the PPA first, then led the discussion on solar yields and the cost structure. Together we checked the park’s own operating data, set the discount rate, double-checked the calculation and wrote the report. The result: the client received a valuation that delivers:
- a fair market value, based on free cash flows until the end of the lifetime;
- a market discount rate that reflects risk and opportunity cost;
- PPA years and post-PPA years shown separately, with a low, base and high market price path;
- a yield forecast backed by operating data, tax incentives reflected, and a valuation report.
Lessons and Questions for Anyone Valuing a Solar Park
Four lessons.
- Read the PPA first. Its price and the years remaining decide most of the revenue.
- Check the park’s own operating data. It supports the yield forecast and the cost estimate.
- Set the discount rate as a market view: how would an independent party set it?
- Show PPA years and post-PPA years separately, so the buyer sees what rests on the contract.
Questions to ask before you build a solar park valuation.
- What return does the fair value imply for a buyer, and is it plausible for the risk?
- How many PPA years remain, at what price, and how much value is contracted?
- What price applies after the PPA ends, and what if it is lower?
- Which limit comes first, the licence or the equipment, and what happens at end of life?
- What discount rate would an independent party set, and why?
- Do the park’s own yields and costs match the forecast, and how much does output age?
- Which tax incentives are still valid, and for how long?
- How much free cash flow can be distributed to the owners?
Planning a similar project? See our Solar financial models. If your park needs something specific, we build custom financial models. Write to us at [email protected].
FAQ
Short answers to the questions readers ask most often when they plan this type of model.
What is a DCF valuation of a solar park?
A DCF valuation estimates the free cash flows the park can still generate until the end of its life and discounts them to today at a rate that reflects risk. Revenue comes from the PPA price and later the market price. Costs and tax incentives are deducted or added year by year, and the discounted cash flows add up to the value.
Why is EV/EBITDA misleading for a solar park?
A multiple of EBITDA (earnings before interest, tax, depreciation and amortisation) is based on current earnings and ignores how long they will last. Two parks with the same EBITDA can have very different remaining lives and PPA terms. A solar park is a finite stream of cash, so the valuation must reflect its age and remaining lifetime.
What happens to a solar park after the PPA ends?
In our model, the park sells electricity on the wholesale market at a forecast price once the PPA ends. The model needs an explicit assumption for these years, for example a low, base and high price path, with the running cost deducted. The valuation then shows the PPA years and the post-PPA years separately.
Why can output not be assumed flat over the lifetime?
In our model, output is highest in the first operating year and then falls by 0.5% a year. This is a modelling assumption, tested against the park’s own operating data. Ignoring ageing would overstate revenue and value.
Client details are anonymised to protect confidentiality. Charts, schematics and worked examples are illustrative and contain no client data.


