
0 ITEMS

Beverage Manufacturing Financial Model Case Study
Key takeaways
- A pre-revenue founder planned a beverage plant that fills drinks under an own brand and for other brands.
- What mattered: revenue per bottle and the channel mix. Investors and lenders ask different questions, so one integrated model had to answer both.
- The turning point: co-packing margins proved thin and create dependency, which made the case for the own brand.
- The founder received a complete start-up model with returns, exit value and bank ratios.
PDF0.9 MB
Free download · No email required
Download the Beverage Manufacturing Financial Model Case Study
✓ Model structure✓ Key assumptions✓ Results and takeaways
Before the first meeting, investors in a new beverage plant ask what they get back and when, how large the downside is, and where the upside sits. They ask how the funds are deployed, how that turns into profit, and whether profit is paid out or reinvested. Lenders ask whether the debt can be serviced. A start-up has no sales history, so the plan itself is tested. An integrated financial model is the preparation: every question needs an answer in the numbers.
The Client and the Decision
The client is a founder in North America who planned a new beverage plant. The company was still pre-revenue. It would produce its own proprietary drinks and also act as a co-packer, filling drinks for other brands. Products would be sold to wholesalers and, to some extent, to retailers, through an online store and at trade fairs, each channel at its own price point. Behind the investment case sat a strategic choice: how much to rely on co-packing, which brings volume and cash quickly, and how much to invest in the own brand, which takes more time, effort and risk. An investor is likely to ask first how much of the plan depends on volumes filled for others. The model had to show what each route is worth.
How a beverage plant makes money. A beverage plant buys ingredients and packaging, fills bottles and sells them. Under its own brand, it earns the full margin between selling price and cost, but it also carries the branding and the sales effort. As a co-packer, it earns a fee for filling another brand’s drinks. The plant has a fixed capacity, so every bottle filled for someone else is a bottle not filled under the own brand.
Why This Was Hard to Model
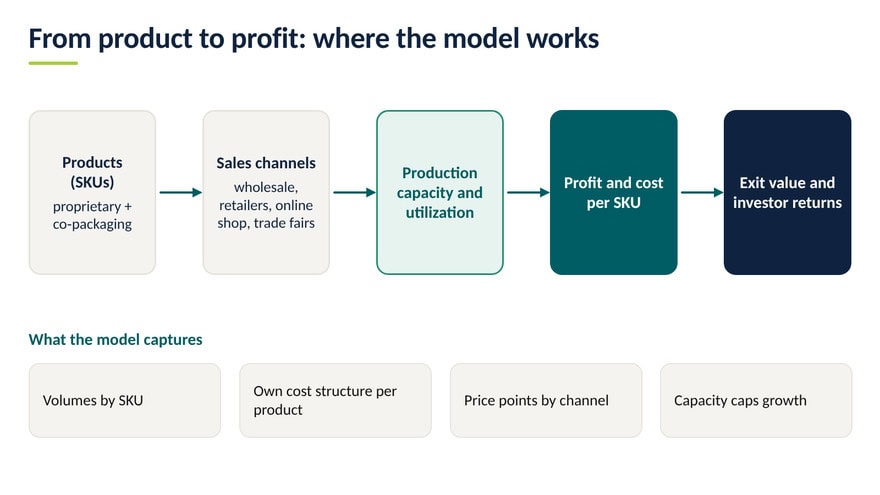
- Own brand and co-packing, modeled SKU by SKU. Own-brand and co-packed products behave differently, and one average per product group would hide the difference the founder needed to see. A choice between two routes can only be judged when each product has its own volume and margin line. How we solved it: We modeled sales volumes by SKU (stock keeping unit), each with its own cost structure and with direct and indirect costs kept apart.
- Several sales channels, several price points. The same bottle sells at different prices to wholesalers, to retailers, through the online store and at trade fairs. Revenue per bottle is the most sensitive input, so it cannot be averaged across channels. How we solved it: We modeled volumes by sales channel and applied the different price points throughout the forecast period.
- Sales can only grow as far as capacity allows. Volumes are only credible if the plant can produce them, and capacity is shared between the two routes. Without that link, a forecast can promise sales the plant cannot deliver, or hide what co-packing costs the own brand. How we solved it: We modeled the planned increases in production capacity and tracked utilization against the sales plan.
- Ramp-up, pricing and inflation. A new product does not sell at full volume on day one. Start dates, growth and prices differ by product, and costs and prices change over time. Timing sets when cash comes in. How we solved it: Every SKU carries its own start date and growth path, and we forecast pricing and inflation separately.
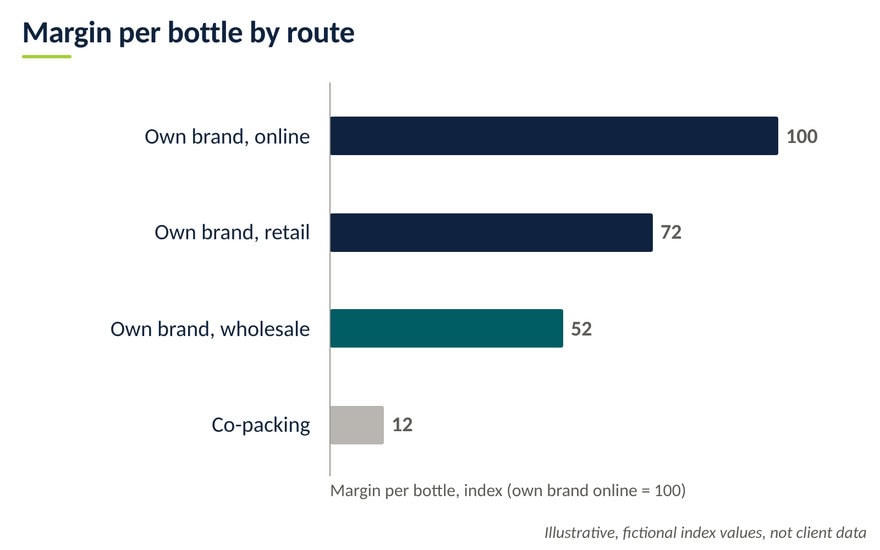
- Finding the real profit drivers. Total margins do not show which assumptions make or break the plan, and investors want to know where the upside sits. How we solved it: We analyzed costs as a percentage of revenue and broke profit down per SKU and channel. Revenue per bottle and the channel mix came out as the main drivers.
- Exit value, investor returns and bank ratios. Investors judge a plan by what they get back, lenders by whether it can service its debt. Both views should come from the same cash flows, so that both conversations use the same numbers. How we solved it: We modeled the exit value and the valuation by year, and calculated project and equity IRR, MOIC, cash-on-cash yield and the bank ratios DSCR and debt/EBITDA, with investor returns based on the investment structure.
The Turning Point: Co-Packing Pays the Bills, the Own Brand Builds the Business
Co-packing is the quick route. Acting as a contract manufacturer for other brands fills the line and generates cash early. Launching an own brand takes more time and effort and carries more risk. The model showed the other side of the picture. Co-packing margins are thin, and relying on other brands creates dependency. That made the case for putting more effort into developing the own brand.
What Drives the Profit
Two inputs moved profit most in this engagement: revenue per bottle and the mix of sales channels. Revenue per bottle depends on the channel and on whether the bottle carries the own brand or is filled for someone else. A worked example with fictional numbers shows how wide the gap can be, first per bottle and then per unit of capacity.
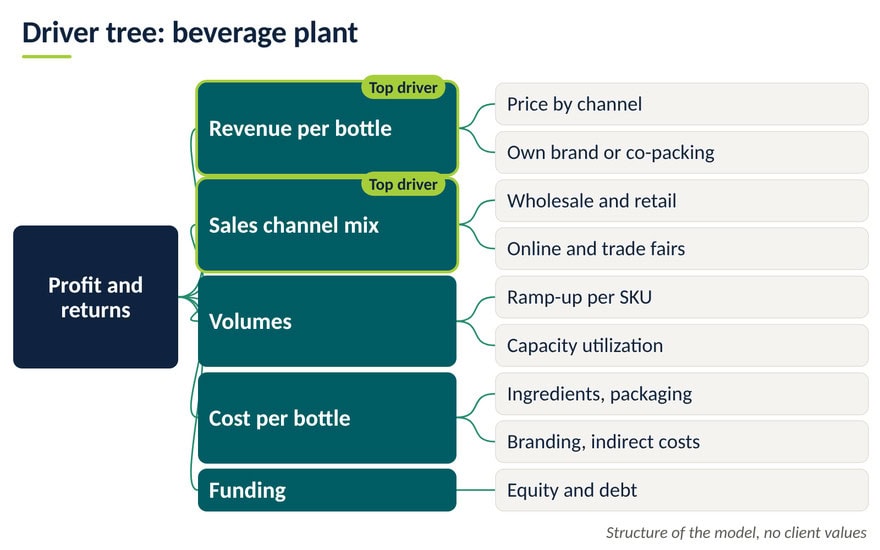
Worked example with fictional numbers: contribution per bottle by route
These numbers are fictional and for illustration only; they are not client data.
| Route | Price per bottle | Cost per bottle | Contribution | Index |
| Own brand, online store | 4.00 | 1.50 | 2.50 | 100 |
| Own brand, retail | 3.30 | 1.50 | 1.80 | 72 |
| Own brand, wholesale | 2.80 | 1.50 | 1.30 | 52 |
| Co-packing fee | 0.30 | carried by brand owner | 0.30 | 12 |
Worked example with fictional numbers: a plant filling 1,000 bottles, by mix
Contribution is shown before branding and sales costs, and without the slower start of an own brand.
| Capacity use | Co-packed bottles | Own-brand bottles (wholesale) | Contribution |
| All co-packing | 1,000 | 0 | 300 |
| Half and half | 500 | 500 | 800 |
| Mostly own brand | 200 | 800 | 1,100 |
Capacity is a trade-off, not only a limit. Every bottle filled for another brand uses line time that an own-brand bottle could have used. The useful comparison is therefore what a co-packed bottle earns against what the same capacity would earn once the own brand has ramped up. The own-brand mix wins only if its sales arrive, so the ramp-up needs as much attention as the margin.
How We Worked Together and the Result
We started by analyzing the concept and led the opening discussion with the founder on where the margin is made. We then planned the structure, drafted the model by SKU and channel, and refined it in several rounds of discussion. A review call walked through the model, and a handover call explained the final version so the founder could work with it. The result: the founder received a complete start-up financial model for the new beverage plant and can show investors and lenders where the margin is made, and why the own brand deserves more of the effort. It delivers:
- profit and cost per SKU and channel, showing which assumptions drive profitability;
- exit value and company valuation by year, to support the investment case;
- project and equity IRR, MOIC, cash-on-cash yield, bank ratios and investor returns.
Lessons and Questions for Anyone Modeling a Beverage Plant
Three lessons.
- Price per bottle by channel decides profit. The same bottle earns very different margins online, in retail and in wholesale.
- Co-packing buys time, not value. It brings early cash, but thin margins and dependency on other brands.
- Capacity caps growth. Tie volumes to capacity and utilization before you forecast sales.
Questions to ask before you build a beverage plant model.
- What do investors get back, and how do invested funds turn into profit?
- Is profit paid out as distributions, or reinvested in the plant?
- What happens to returns and debt service if the ramp-up is slower than planned?
- Which products and channels earn the most per bottle?
- How much of the plan depends on co-packing, and on how few customers?
- Can the plant produce the planned volumes, and at what utilization?
- How fast can each SKU ramp up, and what sets the pace?
- Which costs are direct per bottle, and which are shared?
Planning a similar project? Browse our Manufacturing financial models. If your plant needs something specific, we build custom financial models. Write to us at [email protected].
FAQ
Short answers to the questions readers ask most often when they plan this type of model.
What is a co-packer?
A co-packer, or contract packer, produces and fills drinks for other brands. The brand owner shares the product formulation, and who buys the ingredients and packaging is agreed in the contract, which also sets the price paid for the service. For a new plant, co-packing is a way to use capacity and generate cash before its own products have built up sales.
Is co-packing or an own brand more profitable?
Per bottle, the own brand earns the margin between selling price and cost, while a co-packer earns a filling fee. The own brand also carries branding, marketing and sales costs and a slower start. A model that compares margin per bottle by route and channel, and per unit of capacity, shows how the mix changes profit over time.
Why model a beverage start-up by SKU?
Each SKU has its own ingredients, packaging, price points and growth path. One average product hides which drinks make money and which only fill the line. An SKU-level model shows profit per product and channel, and lets the founder test what happens when a product starts later or grows more slowly.
Which ratios do lenders check in a beverage plan?
Lenders focus on whether the business can service its debt. The debt service coverage ratio (DSCR) shows how easily operating cash flow covers the interest and principal due, and debt/EBITDA relates debt to earnings, which shows how heavily debt weighs on the business. Lenders also want to see how they behave if the ramp-up is slower.
Client details are anonymised to protect confidentiality. Charts, schematics and worked examples are illustrative and contain no client data.


