
0 ITEMS

Gas Well Project Financial Model Case Study

Key Takeaways
- Situation: a developer planned a new gas drilling programme and would look for investors; the gas could be sold, turned into electricity, processed (separating liquids or making products such as CO2) or used for Bitcoin mining, and the developer wanted to capture more value from it.
- What mattered: expected return, risk and upside, which wells, prices and the use of the gas each change, so they belonged in one model.
- Turning point: the developer was seeking ways to capture more value from each unit of gas, so the question moved from how much gas the wells produce to what a unit of gas is worth in each outlet.
- Outcome: the developer can see which scenarios lead to attractive returns, and what remains if the preferred use falls short.
PDF0.7 MB
Free download · No email required
Download the Gas Wells Financial Model Case Study
✓ Model structure✓ Key assumptions✓ Results and takeaways
A gas drilling programme is usually judged on its wells. For this developer the question was wider: is a new programme financially feasible, which scenarios give attractive returns, and how can more value be captured from each unit of gas? That meant modelling what the gas is used for, not only how much there is.
The Developer and the Decision
A developer planned a new programme of gas wells and would look for investors. Investors would ask what the programme returns, what it can lose, and which mix of well results, prices and uses makes it attractive.
What comes out of a gas well. Such wells produce gas, often with side products. Natural gas liquids are hydrocarbons that exist as gas in the reservoir and become liquid at surface conditions. Those recovered at wells or field separators are called lease condensate. Each has its own price, so the model carries them as separate streams. Whether a well counts as a gas well or an oil well is a matter of definition. Reservoir fluids are classed by gas-oil ratio, the gas produced per unit of oil: the higher the ratio, the more gas-like the well, and the line between neighbouring types is not always clear.
The Life of a Well
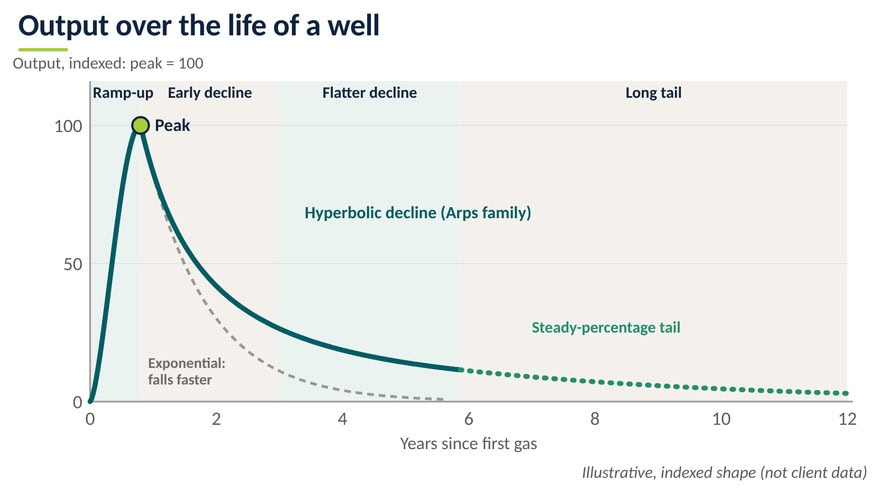
Every well follows one arc: output ramps up to a peak, then declines, steeply at first and flatter later. Decline curve analysis assumes that whatever shaped the past trend continues, and is not expected to be reliable before production has stabilised. The Arps family offers three shapes, exponential, hyperbolic and harmonic, set by one exponent b between 0 and 1. Forecasts usually switch from the hyperbolic shape to a steady-percentage (exponential) decline once the well reaches a terminal decline rate, because a constant exponent would overstate recovery. For a model, supply is highest early, so the gas on offer to any use falls over the programme’s life.
What Can Be Done with the Gas
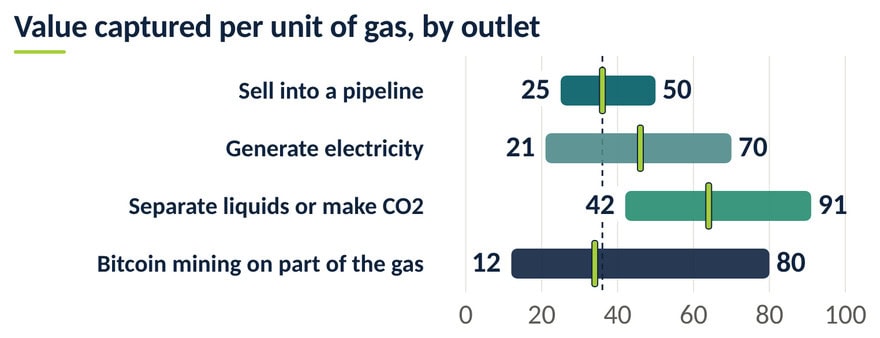
The same gas can go four ways, each with its own capital, risk and return, and the developer was seeking the way that captures the most value.
- Sell into a pipeline: price and volume exposure, no extra plant.
- Generate electricity, to sell or use on site: needs generation equipment and a connection.
- Process the gas: separate natural gas liquids, or make products such as CO2, which was one option examined. One route burns natural gas as fuel in a plant built for the purpose, then concentrates, purifies and liquefies the CO2. Hydrogen and ammonia plants also release CO2 as a by-product that can be recovered. Whether either pays depends on who will buy the product.
- Power Bitcoin mining on site with part of the output, as set out below.
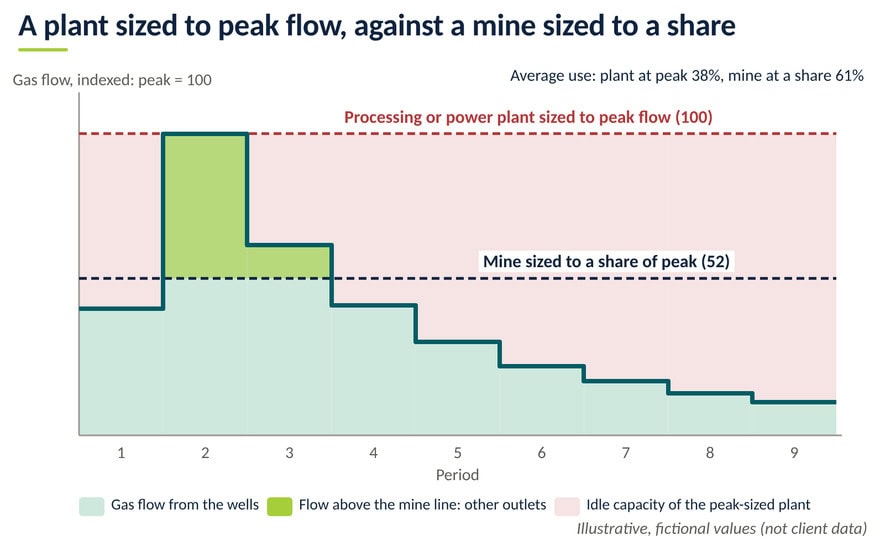
A Bitcoin mine needs its own analysis. It draws power at a set capacity, so it uses only part of the programme’s gas, not the peak. A mine sized to a share of the peak keeps running while the rest of the gas goes to other outlets. Its output also depends on the Bitcoin price, competition between miners and a block reward that halves about every four years. A processing or power plant sized to the peak flow also stands partly idle once the wells decline.
How We Reasoned, Question by Question
- Do all the wells succeed? The wells were considered fairly certain, so the model did not weight them by probability; the spread lies in well performance, which worst, base and best cases cover. With more time we would also examine the probability of success: each prospect has a chance of discovery and a chance of development, and their product is the chance of commerciality. How we solved it: Programme switches show cases with fewer wells. As an extension we recommend risked and unrisked values side by side, above all on unproven ground.
- How fast does output fall? Decline sets revenue, so early rate and decline shape come first. How we solved it: Decline curves by programme feed a monthly grid for every well; a ranked sensitivity view tests rates and steepness.
- Which prices move together? Gas, liquids and the product follow related markets with different swings. One price tested alone creates cases the others could never accompany. How we solved it: Linked price sets move together, so each case stays consistent.
- How much value can each unit of gas capture? A drilling project is normally valued as drill, produce, sell, but the developer was seeking ways to capture more value from each unit of gas. Processing, electricity and on-site Bitcoin mining each promised more revenue, yet each used gas that could be sold. How we solved it: The mechanism was to ask what a unit of gas is worth in each outlet. We charged every option the value the gas would fetch if sold, so each outlet had to earn its capex on top and the comparison became one of added return, not added revenue.
A worked example: does processing earn its plant? Take fictional numbers. Processing yields 0.0627 units of product per unit of gas. In the base case, selling nets 6,770.60 per thousand units and processing nets 12,101.61, so processing adds 5,331.01. The plant is sized for a peak of 9207 thousand units per period, and field output over nine periods follows an index of 42, 100, 63, 43, 31, 23, 18, 14 and 11.
Worked example with fictional numbers: processing against selling, in three cases
| Item | Worst | Base | Best |
| Gas price per unit | 5.23 | 7.26 | 9.87 |
| Product price per unit | 142.32 | 209.30 | 288.83 |
| Well volumes against plan | -35% | plan | +24% |
| Selling, per thousand units | 4,740.60 | 6,770.60 | 9,380.60 |
| Processing, per thousand units | 7,901.96 | 12,101.61 | 17,088.14 |
| Added value, per thousand units | 3,161.36 | 5,331.01 | 7,707.54 |
| Gas through plant, thousand units | 20,647 | 31,764 | 37,178 |
| Added value over plant life | 65,271,726 | 169,335,001 | 286,549,926 |
| Plant cost | 115,751,711 | 115,751,711 | 115,751,711 |
| Result after plant cost | -50,479,985 | 53,583,290 | 170,798,215 |
In the base case the plant earns its cost back, before discounting. In the worst case the added value falls short of the plant cost, so the option is switched off and the gas is sold: the fallback. Averaged over the nine periods, a plant sized to the peak runs at 38% of capacity, while a mine sized to 52% of the peak runs at 61%.
Our view: three tests for a second use of the gas. Does it beat selling the gas, after its own capex? Does it earn its return on late-life volumes, not only at peak? Is the worst case acceptable with it switched off? Sometimes selling the gas is enough.
How We Worked Together and the Result
We analysed the programme in advance and opened with a discussion of feasibility, the investors and the uses of gas to compare. We then agreed the scope, built the model and tested it with worst, base and best cases, which we reviewed together. The developer can see which scenarios lead to attractive returns, and what remains if the preferred use falls short. One model delivers:
- project and equity returns for each use of the gas;
- worst, base and best cases, with selling as the fallback;
- a break-even gas price and debt cover ratios;
- a profit split for each investor class and the developer.
Three Lessons for Anyone Modelling a Gas Project
- Look for the most value in each unit of gas. Setting each outlet against selling the gas shows which one adds return, not just revenue.
- Size downstream assets for the decline, not the peak. A mine takes a share; a plant at peak flow idles.
- Keep a fallback switch. Investors trust a high-upside option more when they can see what remains without it.
Planning a similar project? See our Oil & Gas financial model templates. If your project needs something specific, we build custom financial models. Write to us at [email protected].
FAQ
Short answers to the questions readers ask most often when they plan this type of model.
Is CO2 the only product that can be made from the gas?
No, it was one option examined, next to separating natural gas liquids. For CO2 there are two routes. A plant built for the purpose can burn natural gas as fuel, then concentrate, purify and liquefy the CO2. Steam reforming for hydrogen or ammonia also releases CO2 as a by-product that can be recovered. Whether it pays depends on who will buy it.
Should a drilling programme include probabilities of success?
Where the gas is already proven nearby and the wells are considered fairly certain, scenarios usually carry the uncertainty, as they did here. On unproven ground, risked values, weighted by the chance of discovery and development, should sit next to unrisked ones.
What does a break-even gas price tell investors?
It converts every cost driver into one price at which operating profit is zero. Investors can compare it with the expected gas price to see the cushion: the lower the break-even price, the larger a fall in price the project can absorb. It says nothing about volumes.
Why compare each use of the gas with simply selling it?
Selling the gas is always available, so it sets the value any other outlet must beat. Charging each outlet the value of the gas it consumes shows the return it adds on top, and stops an option from looking attractive only because its gas is counted as free.
Sources
- Decline curve analysis (SPE PetroWiki)
- Terminal decline in decline curve analysis (Hart Energy)
- Natural-gas liquids and lease condensate (AAPG Wiki)
- Petroleum reservoir fluid properties (AAPG Wiki)
- Chance of commerciality (SPE)
- Bitcoin block reward schedule (Bitcoin Wiki)
- Mining competition and difficulty (Bitcoin Developer Guide)
Client details are anonymised to protect confidentiality. Charts, schematics and worked examples are illustrative and contain no client data.


