
0 ITEMS

Private Debt Fund Financial Model Case Study

Key Takeaways
- A start-up planning its first private debt fund needed to raise equity capital from investors for short-term SME loans, with a limited fund term and no bank debt.
- An integrated model came first: with no track record, business model, loan products, cash schedules and profitability had to fit together, tested in three scenarios.
- What mattered: each loan product’s effective interest rate, cash schedules, expected profitability, a possible dividend and a realistic rollout of equity capital.
- The turning point: comparing loan products starts from the effective interest rate, not the nominal interest rate.
PDF3.5 MB
Free download · No email required
Download the Private Debt Fund Financial Model Case Study
✓ Model structure✓ Key assumptions✓ Results and takeaways
A first private debt fund has no track record, so investors judge the plan: the expected return, the risk and the upside. The team must explain its business model, show how equity capital turns into profit and say whether investors can expect a dividend. An integrated financial model puts this into one set of numbers: the business model, the loan products, the cash schedules and the profitability, tested in a worst, base and best case.
The Client and the Decision
A start-up was preparing to launch a private debt fund for short-term loans to small and mid-sized companies, such as export, receivable and equipment financing. Loans of three to twelve months come from a network of partners. As an unproven first fund, it had to be financed entirely with equity capital, with no bank debt. The fund has a limited term, with everything paid back within five years, and a separate management company runs it.
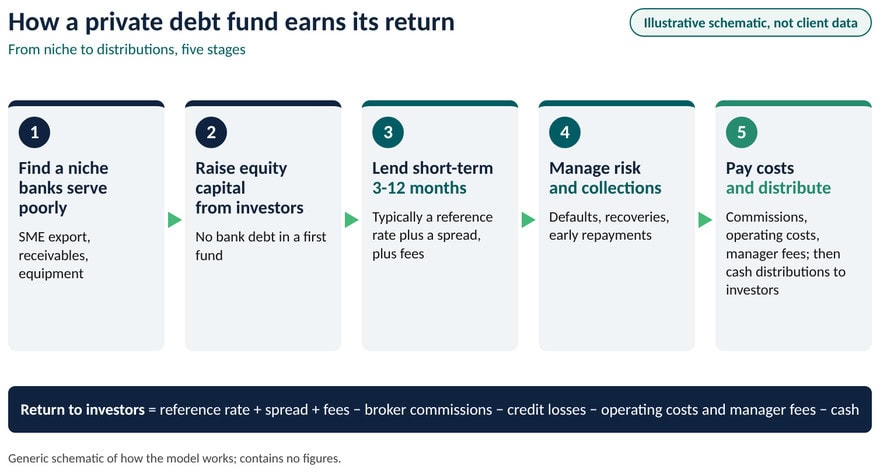
How investors earn from a private debt fund. Investors commit equity capital, and the fund draws it down as it finds loans. Each loan earns interest and usually an upfront fee, and together they are the fund’s income. Loans are typically priced at a reference rate plus a credit spread plus fees, which pays for credit risk and illiquidity. Unlent capital earns nothing. Some borrowers pay late or stop paying. The fund collects and usually recovers part of the balance with a delay; the loss net of recoveries is what investors bear. Brokers, servicing and the management company are paid from the income. The cash waterfall, the order in which cash is used, then passes repaid capital and income to investors as distributions or lends it again during a reinvestment period.
Why This Was Hard to Model
Loans differ in term, repayment pattern, fee and risk, so an average rate hides when cash arrives. The model therefore works loan by loan: it builds a schedule per loan product and adds them up to the fund, where losses, costs and distributions apply.
- Deploying equity capital within a five-year term. How we solved it: We modeled the ramp-up, the reinvestment period and a cut-off after which repayments go back to investors.
- Loan products that pay differently. Equal instalments or balloon payments, cash or accrued interest: the nominal rate does not show what each product earns. How we solved it: After discussions with the management, we modeled the expected allocation and a schedule per product, and compared each product’s effective interest rate and profitability.
- Defaults, recoveries and early repayment. How we solved it: We modeled default and recovery rates and timing by product, reinvestment and an early-repayment fee, because early repayment ends interest sooner and leaves cash idle.
- Payouts to investors and idle cash. How we solved it: We set deployment assumptions and a payout schedule, and tracked idle cash as a drag on return.
- Loans sourced through partners and brokers. How we solved it: We built commissions into the product schedules, so profit is shown after the cost of sourcing.
- NAV, total return and compliance KPIs. How we solved it: We projected net asset value (NAV), distributions and total return, plus KPIs and, where regulation or investors require it, banking-style risk indicators.
The Turning Point: Comparing Loan Products Starts from the Effective Interest Rate
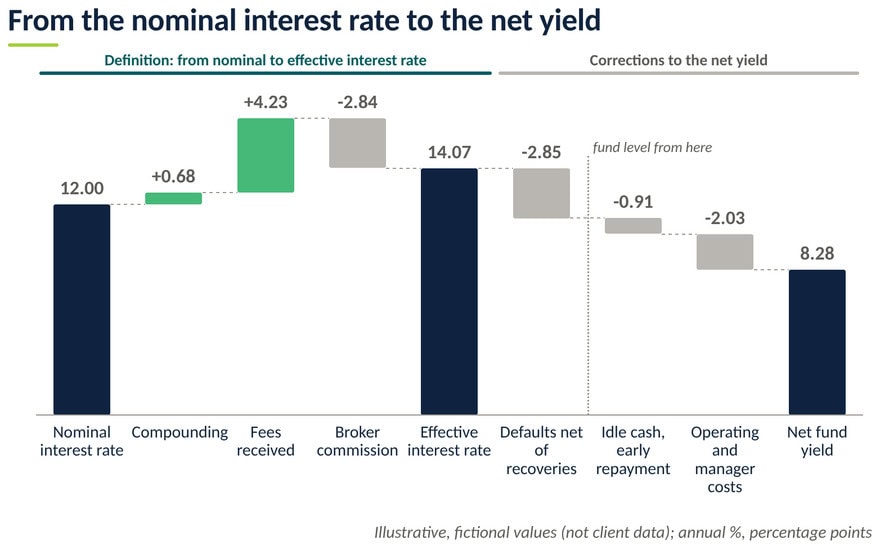
The nominal interest rate is the rate stated in the loan agreement: the starting point of every quote, but not what the fund earns. Compounding, fees received and broker commissions turn it into the effective interest rate: the annual yield implied by the loan’s cash flows (its internal rate of return). Because products pay differently, the model compares them from this rate. Fees received raise the yield, because they reduce the net amount the fund lends out. Broker commissions lower it, because the fund pays them. Here the fee is larger, so the net effect is positive. Defaults net of recoveries, idle cash, early repayment and costs then lower the effective interest rate to the net fund yield.
What Drives the Fund Return
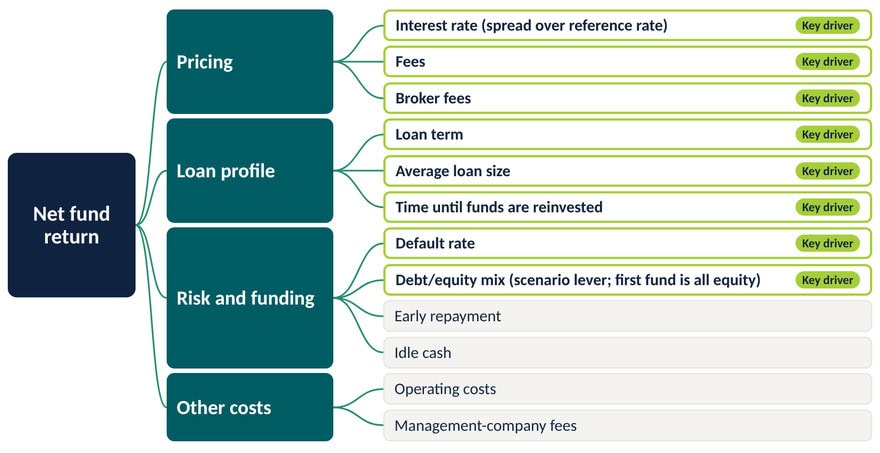
Eight key drivers shape the fund return, in no particular order: interest rate, fees, broker fees, loan term, average loan size, time until funds are reinvested, default rate and the debt/equity mix, a scenario lever (the first fund uses equity capital only). The driver tree below shows them in three groups.
A worked example: same nominal interest rate, different effective interest rate. Take a loan of 100,000 over nine months at a nominal interest rate of 12% a year, with invented numbers. The first three structures share this nominal rate and differ only in repayment structure. The fourth adds a fee received and a commission paid, which change the opening outlay, and the fifth adds a credit loss.
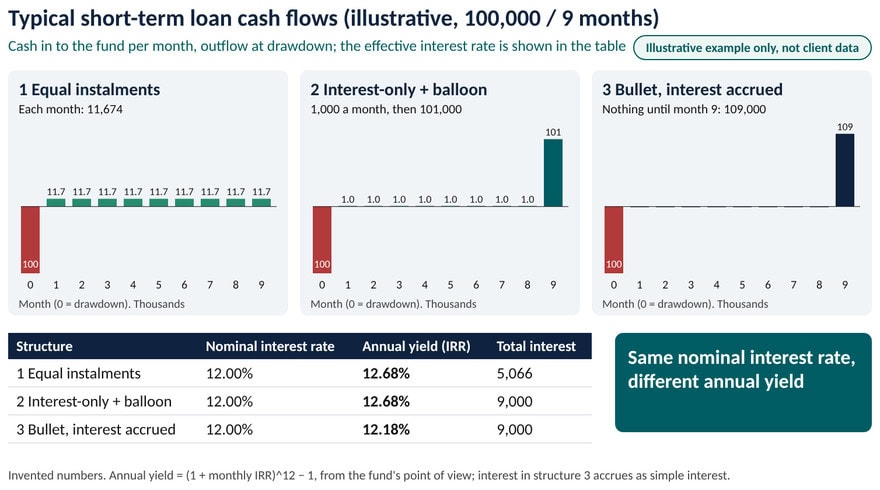
Worked example with fictional numbers: loan of 100,000, nine months, 12% nominal interest rate
| Structure | Total cash in | Net profit | Annual yield (IRR) |
| Equal monthly instalments | 105,066 | 5,066 | 12.68% |
| Monthly interest, principal at maturity | 109,000 | 9,000 | 12.68% |
| All interest accrued (simple), paid at maturity | 109,000 | 9,000 | 12.18% |
| Equal instalments; 1.5% fee received and 1.0% broker commission paid at drawdown (net outlay 99,500) | 105,066 | 5,566 | 14.07% |
| As above, but 3% of the loan stops paying after month 3; half of that balance is recovered in month 8 | 103,980 | 4,480 | 11.22% |
The first three rows share a nominal interest rate, and the gap is small. Monthly interest gives 12.68%, which is 1% a month compounded. Simple interest accrued to maturity gives 12.18%, because nothing is reinvested before month 9. Profit differs far more (5,066 against 9,000), because equal instalments return capital earlier and that cash must be lent again. Corrections matter more. The fee lifts the yield to 16.91% and the commission brings it back to 14.07%, the effective interest rate of this loan. Row 5 adds a credit loss, so its 11.22% is a yield after losses. Loan-level rates come before fund costs, so they are not fund returns.
What the worst, base and best case showed. The model recomputes the whole forecast when an assumption changes:
- Worst case: higher defaults, slower recoveries, more early repayments. The net return falls; the model shows whether a dividend is still realistic.
- Base case: expected defaults and reinvestment times, giving the expected net return and payout schedule.
- Best case: fewer defaults, quicker reinvestment and less idle cash, showing the upside.
How We Worked Together and the Result
We analysed the business model and loan products and discussed them with the management in several rounds. We then agreed the plan (allocation, equity capital rollout, scenarios, structure), built the model and helped explain it in an investor presentation. The result: the management received an integrated model with:
- schedules by loan product, from drawdown to recovery;
- the effective interest rate and profitability by product, from the fund’s point of view;
- projected NAV, cash schedules, distributions and annual total return, with KPIs;
- worst, base and best case scenarios and sensitivities.
Lessons and Questions for Anyone Modeling a Private Debt Fund
Three lessons.
- Compare loan products by their effective interest rate, not the nominal interest rate. Timing, fees and losses change what the fund earns.
- Model cash, not only interest. Idle cash and early repayments cost return even when no loan defaults, and a dividend can only be paid from cash actually received.
- Test the worst and best case. Investors judge expected return, risk and upside, so show total return in all three.
Questions to ask before you build a private debt fund model.
- What return can investors expect in the worst, base and best case?
- How quickly is equity capital deployed and does it start to earn?
- How does the business model turn deployed funds into profit?
- Can investors expect a dividend, and from when?
- What does each loan product earn, by effective interest rate?
- How much return do defaults, early repayments and idle cash take away?
- Which assumptions move the annual fund return most?
- Does the fund meet the risk and compliance KPIs that apply?
Planning a similar project? See our Financial Services financial models. If your fund needs something specific, we build custom financial models. Write to us at [email protected].
FAQ
Short answers to the questions readers ask most often when they plan this type of model.
How do private debt funds earn returns?
A fund lends at a reference rate plus a credit spread and usually adds fees. Investors receive what is left after broker commissions, credit losses net of recoveries, operating costs and manager fees, and after the drag from cash that sits unlent. The result is usually reported as a net IRR, the annualised return after fees and costs, together with distributions.
What is the difference between the nominal and the effective interest rate?
The nominal interest rate is the stated annual rate of a loan. The effective interest rate is the annual rate that results from the loan’s actual cash flows, including payment timing, compounding and fees. Two loans with the same nominal rate can have different effective rates, for example when one pays interest monthly and the other at maturity.
What are Basel II and Basel III, and do they apply to a private debt fund?
Basel II (2004) is a bank capital framework, now superseded; Basel III strengthened it with capital buffers, a leverage ratio and liquidity standards. Both are standards for banks that take effect through national law or regulation; a non-bank fund follows its own fund regulation and investor documents. Banking-style KPIs can serve as reference points, and the model projects them where regulation or investors require it.
What is the total return of a fund?
Total return for a period is the change in net asset value (NAV), excluding capital paid in or returned, plus income distributions, divided by the opening NAV. NAV is the value of the fund’s assets minus its liabilities. A fund that pays out most income shows modest NAV growth, so total return shows what investors received. The model projects NAV, distributions and total return.
Sources
- Bank for International Settlements: Basel II, International Convergence of Capital Measurement (2004, superseded)
- Bank for International Settlements: Basel III, the Basel Committee’s reforms
Client details are anonymised to protect confidentiality. Charts, schematics and worked examples are illustrative and contain no client data.


