
0 ITEMS

Product Rollout Financial Model Case Study

Key Takeaways
- A serial entrepreneur planned the rollout of a packaged consumer food product through retail partners and needed a financial model.
- What mattered: the investment view. Marketing is paid first at each location, payback shows how long profits need to recover it, and that cash funds the next location, all tested in one model before money was committed.
- Turning point: from a volume-first wholesale push to direct retail partnerships with full marketing packages, with the rollout order set by payback.
- Outcome: a fully dynamic model with a plan by location, payback per location, reinvestment of profits and room to run scenarios.
PDF4.0 MB
Free download · No email required
Download the Product Rollout Financial Model Case Study
✓ Model structure✓ Key assumptions✓ Results and takeaways
Whoever backs a product rollout asks the same things. What does the marketing spend return, and how long until it is back? What if the marketing works less well than planned? Are profits taken out, or used to open the next location? The financial model has to answer these questions in numbers before the money is committed.
The Client and the Decision
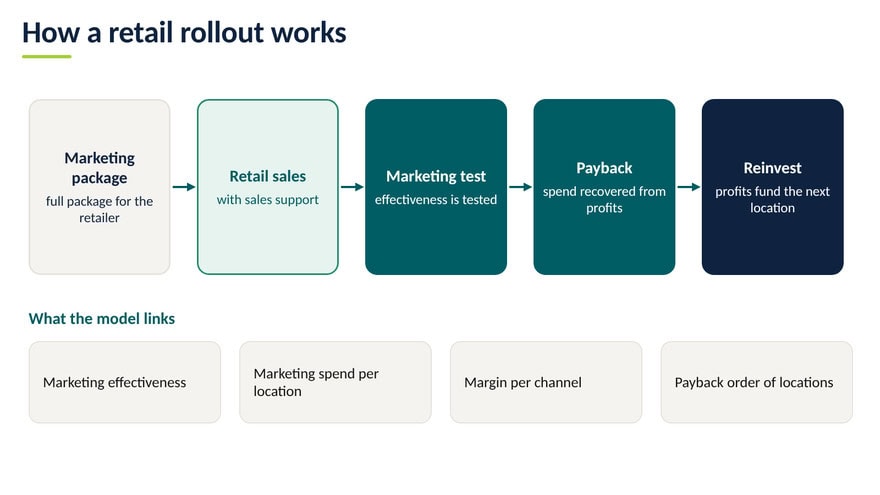
The client is a serial entrepreneur who was bringing a packaged consumer food product to market. The decision was how to reach consumers: through wholesale volume, or through retail partners, location by location, with the marketing that makes the product sell. Each location starts with a marketing package for the retailer, mostly on-site activities. Volumes then grow with traffic, competitors and expected market share. Working with retailers directly makes the effectiveness of the marketing testable. The profits of a location repay its marketing spend and then help to pay for the next location.
The investment view: the payback period. Seen as an investment, a rollout is simple. At each new location the client first pays for direct marketing. The location then earns profit that builds up as sales ramp up. The payback period is the time until the cumulative profit of that location has recovered the marketing outlay. The model tracks this as a cumulative cash curve per location. The curve starts below zero, at the marketing outlay, rises as profit builds up and crosses zero at payback. Three things move that crossing: the marketing cost per location, the speed of the ramp-up and the margin.
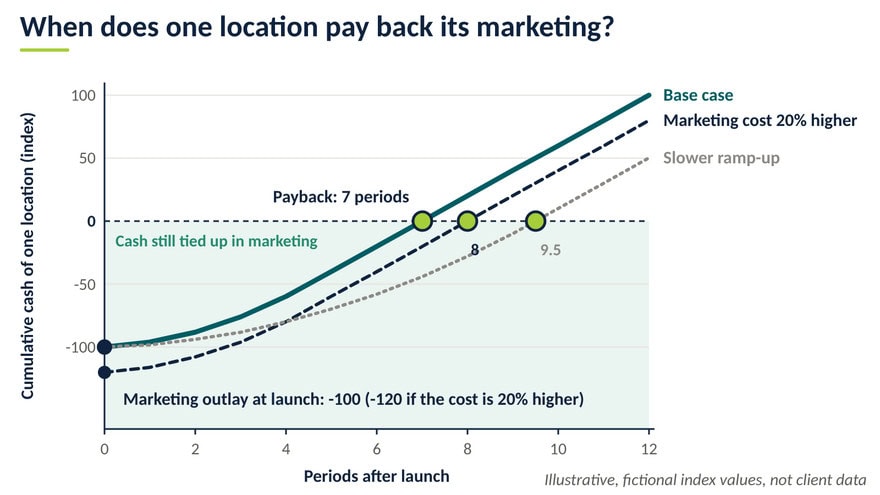
A worked example makes it concrete. A location costs 100 in marketing. Profit starts at 4 in the first period and grows by 4 each period until it reaches 20.
Worked example with fictional numbers: payback of one location
| Period | 0 | 1 | 2 | 3 | 4 | 5 | 6 | 7 |
| Cash in the period | -100 | 4 | 8 | 12 | 16 | 20 | 20 | 20 |
| Cum. cash | -100 | -96 | -88 | -76 | -60 | -40 | -20 | 0 |
Now change one input at a time:
Worked example with fictional numbers: what moves the payback period
| Case | Change | Payback in periods |
| Base case | none | 7 |
| Marketing cost | 20% higher (120) | 8 |
| Ramp-up | full profit after 10 periods, not 5 | 9.5 |
| Margin | 20% lower profit in every period | 8.25 |
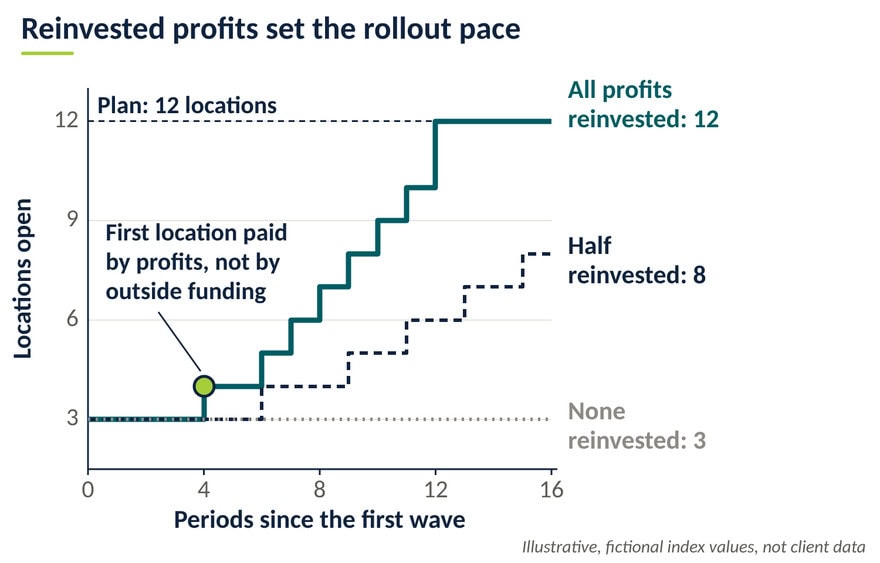
Cash deployment: profits pay for the next locations. A fast rollout needs cash at the right time. A first wave of locations needs funding. As these locations earn, their profits pay for marketing at the next ones, so shorter payback means an earlier next wave. In the illustration, the plan has 12 locations and marketing costs 100 per location. The first wave of three needs outside funding of 300. The fourth location is paid from profits in period 4. With all profits reinvested, all 12 locations are open in period 12; with half reinvested, 8 are open after 16 periods; without reinvestment, the rollout stays at three. The model tests the reinvestment share, the pace of the rollout, the outside funding needed and the period from which the rollout funds itself.
Worked example with fictional numbers: sources and uses by wave
| Wave | Locations | Marketing spend | Funded by |
| 1 | 1 to 3 (period 0) | 300 | Outside funding 300 |
| 2 | 4 to 8 (periods 4 to 9) | 500 | Profits of open locations 500 |
| 3 | 9 to 12 (periods 10 to 12) | 400 | Profits of open locations 400 |
| Total | 12 | 1,200 | Outside 300, profits 900 |
Why This Was Hard to Model
- A strategy built on marketing effectiveness. Selling directly to retailers with full marketing packages shifted the key driver from volume to how well the marketing works. How we solved it: We built the model around the rollout and its marketing effectiveness, so the marketing plan can be tested and its effect on results is visible.
- Payback of the marketing outlay per location. Marketing is paid before a location earns, so each launch starts with negative cash. Payback decides which location comes first. How we solved it: We calculate cumulative cash per location, so the rollout order and the levers behind payback are visible.
- Funding the rollout from its own profits. The pace depends on payback and on how much profit is reinvested instead of taken out. How we solved it: We modeled reinvestment in waves, with reinvestment share, pace and outside funding as inputs.
- Marketing packages and discounts as the main costs. Their size and timing depend on the pace of the rollout, as most of the spend goes to on-site marketing activities. They come before the profits they create. How we solved it: We modeled marketing and discount costs in line with the planned rollout pace, and analyzed cost structure and profitability drivers.
- Every location has its own profile. Each location has its own traffic and volume growth, competitors, start date, incentives and commissions. An average would hide the locations that pay back fast. How we solved it: We built a model that reflects these differences for each location.
The Turning Point: From Volume-First Wholesale to Direct Retail Partnerships
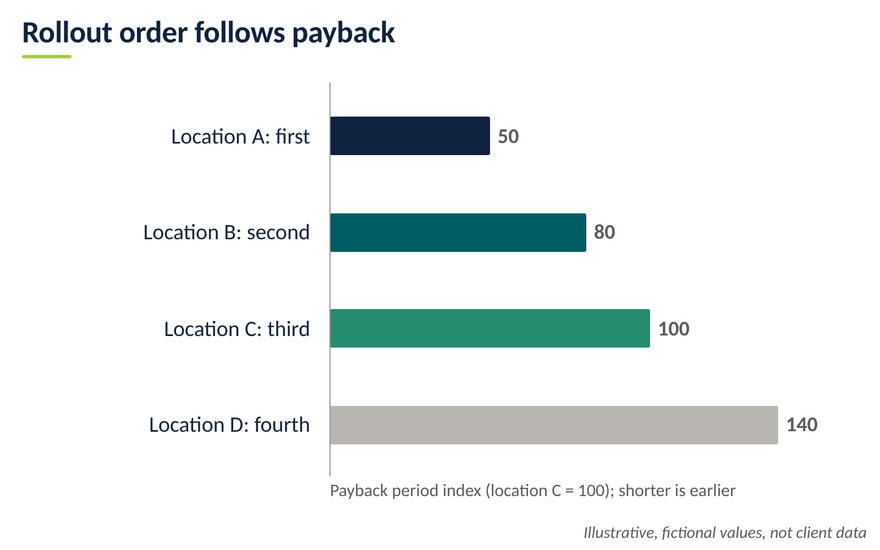
The first plan was to sell large volumes quickly through wholesale. For this food product, success depends on the effectiveness of the marketing campaign. So the plan moved closer to the end consumers: working with retailers directly, offering them full marketing packages and supporting their sales. This made it possible to test the marketing plan, and in the long term it offers better margins. That was the deciding factor. The question for the model changed from how many units to ship to what each location returns on its marketing spend. The rollout order then follows payback, shortest first.
What Drives the Value
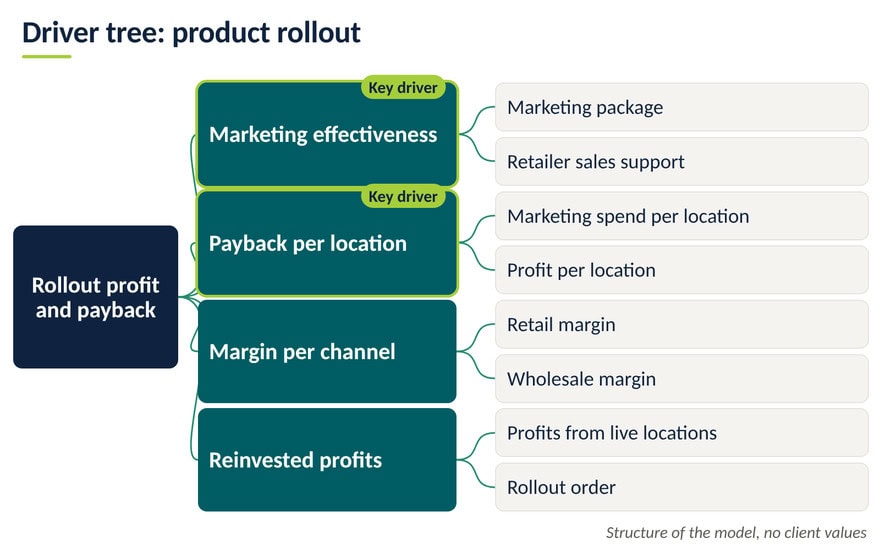
Marketing effectiveness and the payback period per location matter most. Margin per channel shapes the long-term result; marketing spend per location and reinvested profits decide how fast the rollout grows. A rollout commits marketing spend before profits arrive, so an unproven assumption is repeated in every location. Testing the marketing plan in the first locations, and letting payback set the order, limits the money exposed to an assumption that has not yet proven itself.
Worked example with fictional numbers: payback sets the order
| Item | Location A | Location B | Location C | Location D |
| Marketing spend | 20,000 | 24,000 | 18,000 | 21,000 |
| Profit per period after launch | 8,000 | 6,000 | 3,600 | 3,000 |
| Payback (spend / profit) | 2.5 | 4.0 | 5.0 | 7.0 |
| Payback index (C = 100) | 50 | 80 | 100 | 140 |
| Rollout order | 1 | 2 | 3 | 4 |
How We Worked Together and the Result
We started by analyzing the strategy and the product, and led the opening discussion on the key value drivers. We then planned the structure and built the model around the rollout, payback and reinvestment. A review call went through the results and value drivers, and we handed over a fully dynamic model that the client can change independently. The client received a fully dynamic financial model. It delivers:
- A plan by location: timing, volumes, market share, incentives and commissions.
- Marketing and discount costs linked to the rollout pace, with profitability drivers analyzed.
- Payback per location and a view of cash deployment: rollout order, share of profit reinvested, outside funding needed and the point from which the rollout funds itself.
- Assumptions can be changed, so new scenarios can be run at any time.
Lessons and Questions for Anyone Planning a Consumer Product Rollout
Three lessons.
- Let the product set the drivers. For a consumer food product, marketing effectiveness comes first, because every location repeats the same marketing assumption.
- Plan by location. Traffic, competition, incentives and growth differ, so averages mislead and hide the locations that pay back fast.
- Roll out where payback is shortest. Profits come back sooner and can be reinvested, so each wave of locations starts earlier.
Questions to ask before you build a product rollout model.
- How effective is the marketing campaign, and how will you test it?
- What does a full marketing package cost per location, and how long does it take to pay back?
- What moves the payback period: marketing cost, ramp-up speed or margin per channel?
- Which locations pay back the marketing spend fastest?
- How much of each location’s profit is reinvested in the next one?
- How much outside funding does the first wave need, and when does the rollout fund itself?
- How do traffic, competitors, incentives and commissions differ by location?
- What happens to payback and rollout order if marketing effectiveness is lower than planned?
Planning a similar project? See our Manufacturing financial models. If your project needs something specific, we build custom financial models. Write to us at [email protected].
FAQ
Short answers to the questions readers ask most often when they plan this type of model.
What is a product rollout financial model?
It plans how a product is introduced step by step, for example location by location. It links each start to volumes, market share, incentives, marketing costs and profit, and shows what each launch costs, when it pays back and how much can be reinvested. Changing assumptions lets you compare many scenarios.
What is a payback period for marketing spend?
It is the time until the cumulative profit of a location has recovered the marketing spend made there. It depends on the marketing cost, how fast sales ramp up and the margin. A short payback means the money returns quickly and can be reinvested, so payback helps to decide which location comes first.
Why reinvest profits in new locations?
Profits from locations that are already open can pay for marketing at the next locations, so less outside funding is needed and the rollout runs faster. The shorter the payback, the sooner cash is available for the next wave. A model shows when the rollout funds itself.
Why work with retailers directly instead of selling through wholesale?
Wholesale means selling goods in bulk to buyers other than the end consumer, so you sit further from the people who use the product. Working with retailers directly, with marketing packages and sales support, lets you test how effective the marketing is and can offer better long-term margins.
Client details are anonymised to protect confidentiality. Charts, schematics and worked examples are illustrative and contain no client data.


