Pizzeria Financial Model Excel Template
Get Your Pizzeria Budget Template. Excel template – robust and powerful. This is your solid foundation to plan your business model. Five-year horizon financial model excel spreadsheet for the pizzeria business for early-stage startups to impress investors and raise capital. Pizzeria Five Year Financial Projection Template helps you evaluate your startup idea and/or plan a startup costs. Unlocked – edit all – last updated in Sep 2020. The pizzeria cash flow proforma template includes all required forecasting reports, including assumptions, p&l forecast (p&l forecast), cash flow statement projection, balance sheet, performance KPIs, and financial summaries for months and years (incl. numerous graphs and KPIs).

NOTE: Single-User pertains to a limited Single User License where the template can only be used by one single user; while Multi-User is a license for users sharing the template with up to 20 members. Please refer to Terms of Use and License and Permitted Use for clarification.
PIZZERIA THREE WAY FINANCIAL MODEL KEY FEATURES
Video tutorial:
Investors ready
Print-ready (including a pro forma p&l statement, a Cash Flow Statement For 5 Years, a balance sheet, and a complete set of financial ratios).
Get a Robust, Powerful, and Flexible Financial Model
This well-tested, robust and powerful Pizzeria 3 Way Financial Model Template is your solid foundation to plan a business model. Advanced users are free to expand and tailor all sheets as desired, to handle specific requirements or to get into greater detail.
Get it Right the First Time
Funding is a binary event: either you succeed or you fail. If you fail, most investors won’t give you a second chance. Learn about the pros and cons of Pizzeria Financial Projection Excel.
Update anytime
You can easily adjust inputs at the launch stage and throughout the further activities of your business to refine your Pizzeria Budget Financial Model.
Gaining trust from stakeholders
Investors and financing providers tend to think in terms of the big picture. They want the c-level of the companies they invest in to do the same to ensure they maintain a clear idea of the future. Providing stakeholders with a monthly projected cash flow statement format will demonstrate a level of awareness that leads to confidence and trust and will make it easier to raise more investment.
Plan for Future Growth
Cash Flow Forecast can help you plan for future growth and expansion. No matter you’re extending your company with new employees and need to take into account increased staff expenses. Or to scale production to keep up with increased sales, future projections help you see accurately where you’re running — and how you’ll get there. Forecasting is also a well-known goal-setting framework to help you plan out the financial steps your company has to take to reach targets. There’s power in Projected Cash Flow Statement and the insight they can provide your business. Fortunately, this competitive advantage comes with little effort when you use the Pro Forma Cash Flow Projection.
REPORTS and INPUTS
Operational KPIs
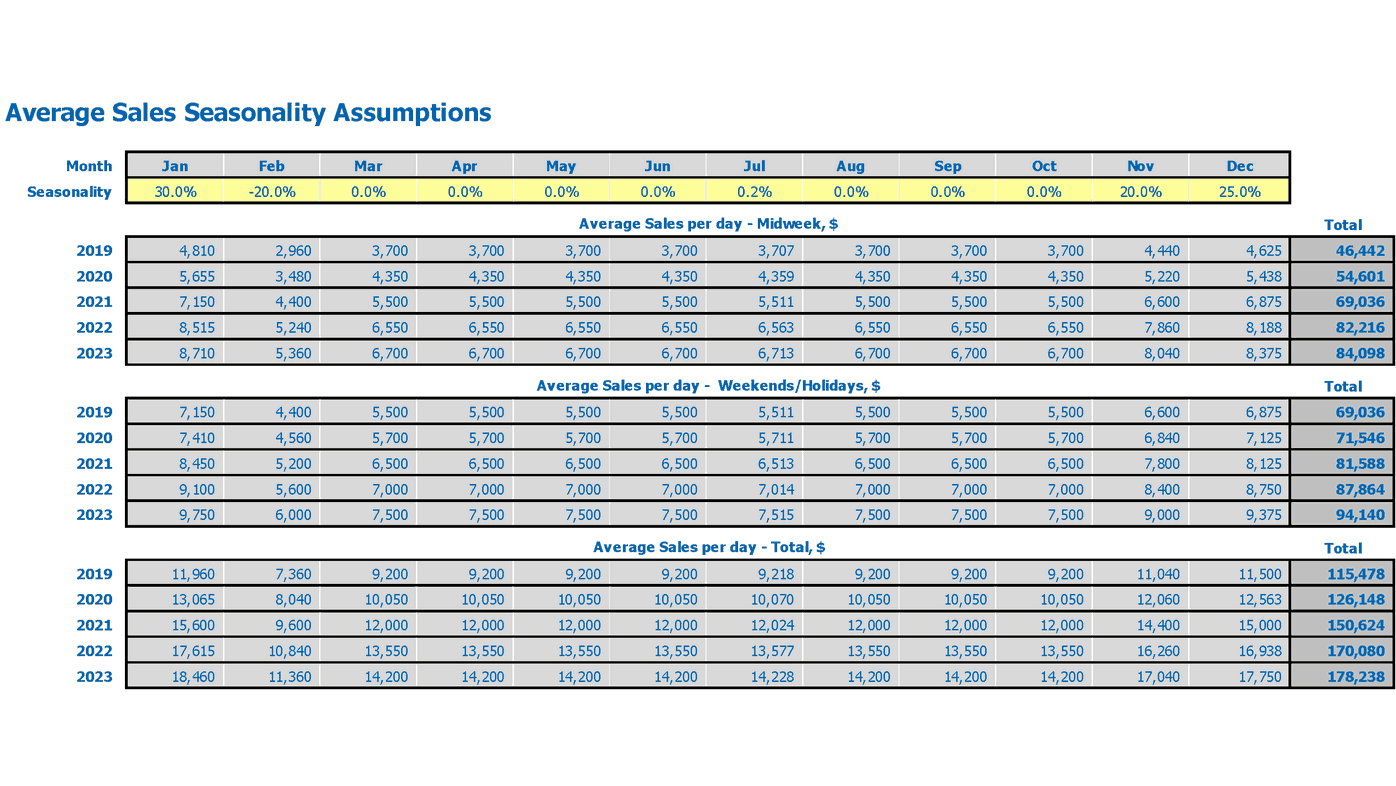
Financial graphs and charts in this Pizzeria P&L Projection help the stakeholders visually track liquidity, budgets, expenses, cash flow, and many other company financial metrics. These graphs will also help a company’s management avoid problems by reflecting its financial data in real-time, with a comprehensive financial information overview.
These operational performance graphs will help the business owners and financial managers ensure the best possible performance and financial health of their company because regular financial analytics procedures and the highest quality of financial data are the company’s top priorities.
Our financial graphs will also help the company’s financial specialists raise financial issues at the general meetings and deliver understandable financial information to other departments and external stakeholders.
Performance KPIs
Return on capital. The return on capital reflects the correspondence of the Balance Sheet and Income Statement. Return on capital measures the accomplishment of earnings to the capital employed.
Companies with good financial management have good returns.
Financial KPIs
The Pizzeria Pro Forma Budget has key financial indicators (KPIs) that show sales and profitability performance: revenue growth rate, gross margin, and EBITDA margin.
It also has KPIs related to cash flows and raising investment: the cash burn rate, runway, and funding need. You can choose the KPIs relevant to your company and industry, and monitor your company’s performance. For example, SaaS companies typically monitor and manage customer lifetime value (LTV), customer acquisition costs (CAC), LTV/CAC ratio, and the churn rate. For SaaS businesses, these KPIs are crucial.
Financial Statements
The Pizzeria Cash Flow Proforma has a pre-built integrated financial statement structure. It has pre-built templates for the primary financial statements: Balance sheet, profit and loss statement, cash flow statement by month, and Statement of Shareholders’ Capital. All these financial statements are precisely defined and interconnected with the inputs and other spreadsheets within the model.
Dashboard
Our Pizzeria Excel Pro Forma has a dashboard that summarizes information from the other spreadsheets of the Financial Projection Model Excel. With this dashboard, you can set your key performance indicators (KPIs), and the dashboard will include them in the calculations and the information from the financial statements. You can create the dashboard with core financial information on a month-by-month basis and change it any time you need.
Valuation
With our Pizzeria Pro Forma, you will get proformas for valuation analysis. You will be able to perform a Discounted Cash Flow (DCF) valuation analysis and other valuations you may need.
Cap Table
A Cap table is a critical spreadsheet for any start-up company that shows all the company’s shares, who owns them, and the investors’ prices for these shares. The 3 Way Financial Model (cap table tab) also reflects each investor’s percentage of ownership in the company and its dilution.
File types:
Excel – Single-User: .xlsx
Excel – Multi-User: .xlsx
Free Demo – .xlsx
Similar Products
Other customers were also interested in...
Food Truck Financial Model Excel Template
Purchase Food Truck Financial Projection Template. Excel Template for your pitch deck to convince In... Read more
Gourmet Food Store Financial Model Excel Template
Gourmet Food Store Financial Model Allows you to start planning with no fuss and maximum of help . S... Read more
Confectionery Shop Financial Model Excel Template
Confectionery Shop Financial Plan Allows investors and business owners to make a complete financial ... Read more
BAKERY – 3 Statement Financial Model with 5 ...
This Bakery Business Plan Model is a perfect tool for a financial feasibility study on launching a B... Read more
Bakery Financial Model Excel Template
Shop Bakery Budget Template. Solid package of print-ready reports, including P&L and cash flow s... Read more
Coffee Shop Financial Model Excel Template
Download Coffee Shop Financial Model Template. Allows you to start planning with no fuss and maximum... Read more
Coffee Truck Financial Model Excel Template
Get the Best Coffee Truck Financial Projection Template. Creates a financial summary formatted for y... Read more
Pizzeria – 3 Statement Financial Model with ...
This Pizzeria business Plan Model is a perfect tool for a financial feasibility study on launching a... Read more
Start Up Food Truck Business Financial Model
Start Up Food Truck Business Financial Model presents the case of an investment in a food truck busi... Read more
Fast Food Chain Financial Model
The financial model presents the business case of a startup fast-food chain. The model accommodates ... Read more
You must log in to submit a review.


