Monthly Dynamic 3 Statements & Valuation
The template contains the cash flow statement, the income statement, the balance sheet statement as well as ratios, variance analysis, and valuation of the business. All the statements together produce an overall picture of the health of the business
General Overview
The template contains the cash flow statement, the income statement, the balance sheet statement as well as ratios, variance analysis, and valuation of the business. All the statements together produce an overall picture of the health of the business.
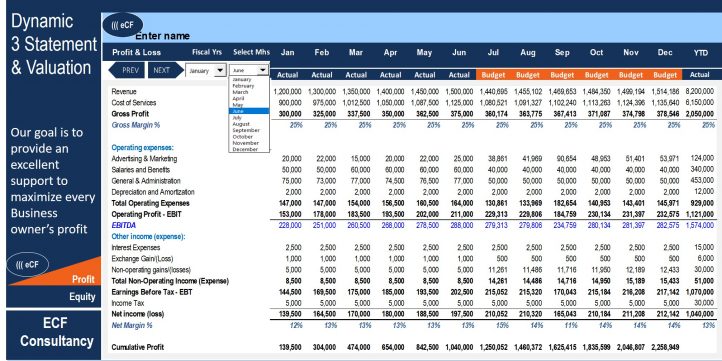
The template showing statements for 12 months, actual year to date by selecting on monthly basis the current month from the selection box in the “Profit & Loss” sheet under column C, and instantly the model will show the budget for the remaining months of the year, also the user can change the fiscal year by choosing the startup month from the selection box in “Profit & Loss” sheet under column B.
The model follows the best practice financial modeling principles and includes instructions and explanations.
So, a quick overview of the model, in the contents sheet you can see the structure of the model, and by clicking on any of the headlines will automatically be redirected to the relevant sheet.
Inputs in the green tabs
Update the general info in the “Front Page” sheet
Enter the budget income statement and balance sheet for 12 months in the “Budget” sheet, fill only the green cells
Choose the current month from the selection box in the “Profit & Loss” sheet under column C
Enter on a monthly basis the actual income statement and balance sheet in the “PY & YTD” sheet, fill only the green cells
Fill the green cells only in the “Valuation” sheet, for valuation and WACC calculator purpose
Outputs
The inputs in the green cells will dynamically flow into the following below:
Profit and loss statement by month including 3 major components, gross profit, EBITDA, and net profit
Balance sheet by month including total assets, total liability, and owners’ equity
Cash flow by month with 3 outputs such as operating cash flow, investing cash flow, and financing cash flow
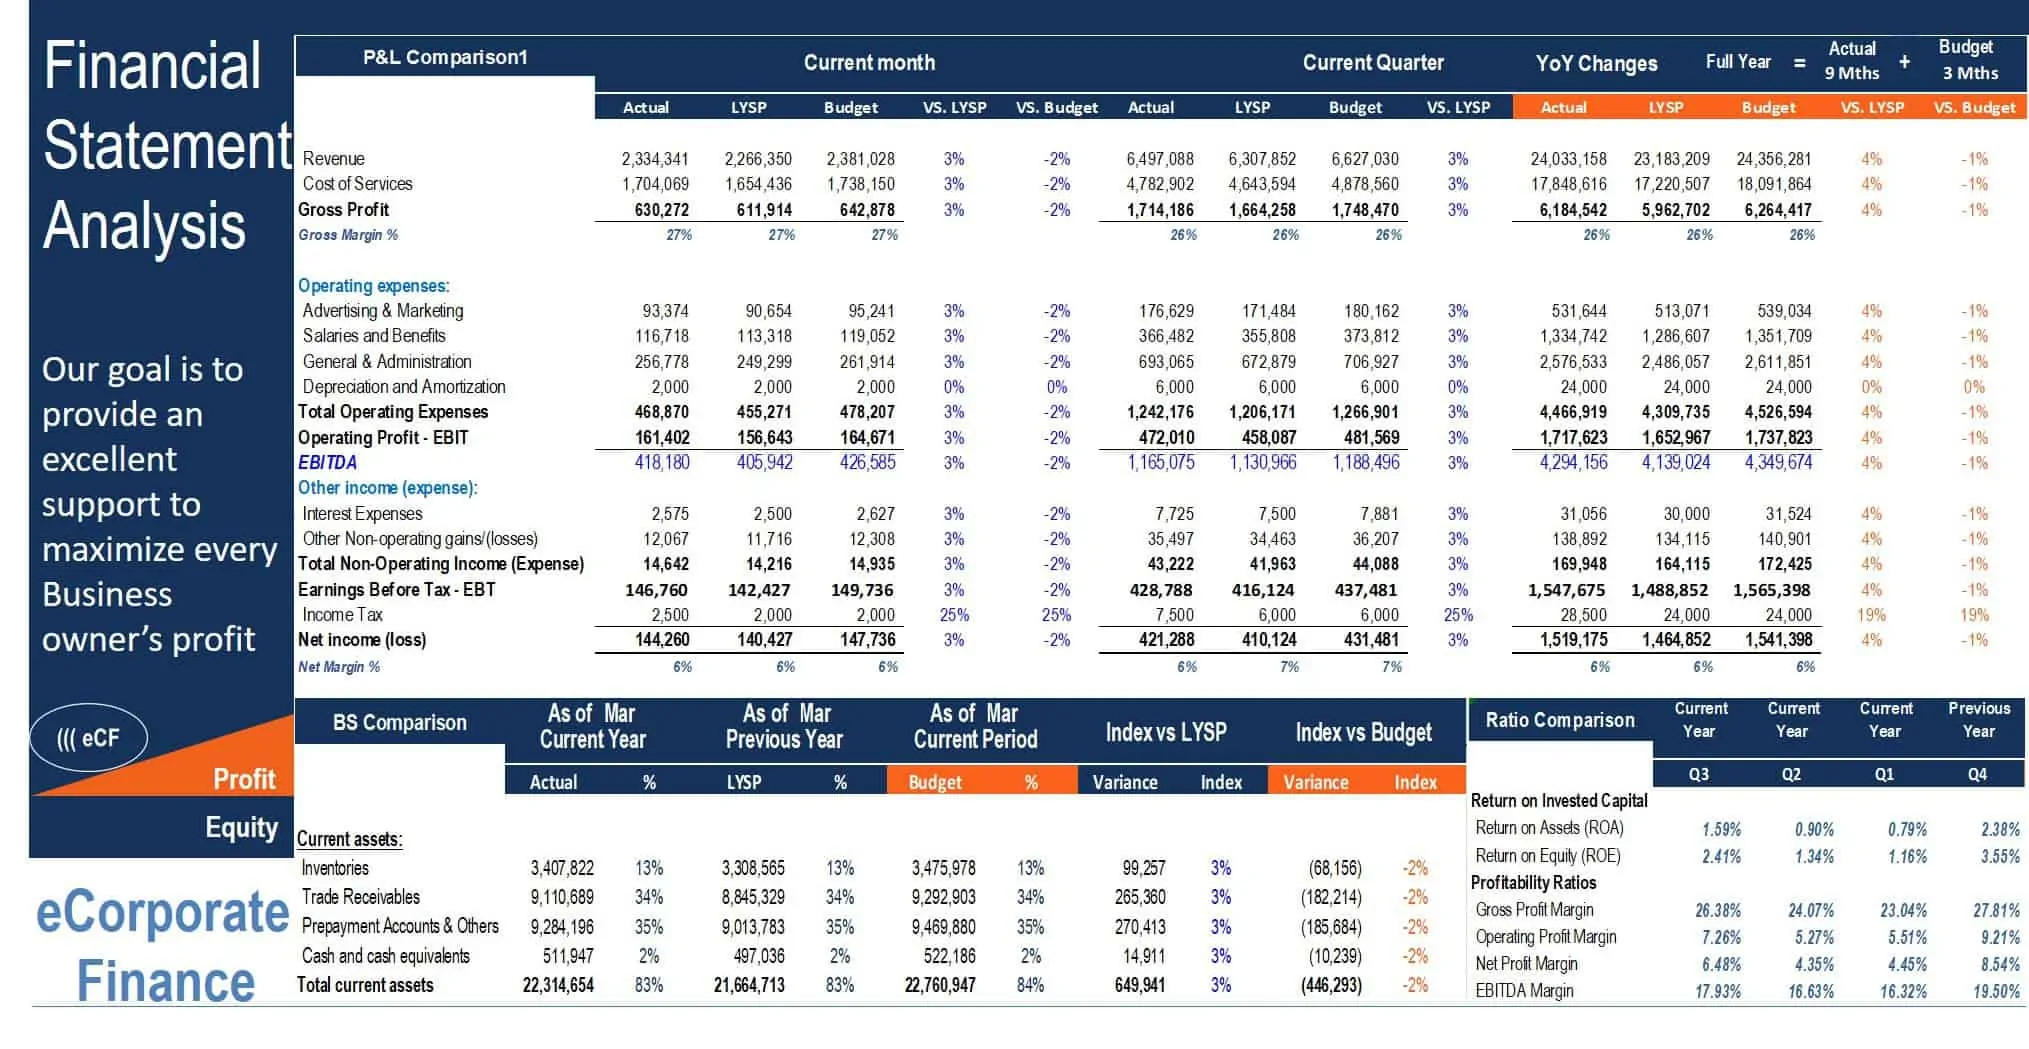
P&L comparison with outputs such as actual vs budget for the current month, actual vs budget year to date, and actual vs budget for the full year
Ratios with 6 main components, such as return on investment, profitability ratio, liquidity ratio, solvency ratio, activity ratio, and leverage ratio,
WACC, NPV, Discounting cash flow for 5 years forecasting
Intrinsic value, Market value, and sensitive analysis
Dashboard summary
Conclusion and customization
Highly versatile, very sophisticated financial template, and user-friendly.
If you have any inquiries, any modifications, or customization requests of the model for your business, please reach us through: [email protected]
Similar Products
Other customers were also interested in...
Corporate Finance Toolkit – 24 Financial Mod...
They are essential models to increase your productivity, plan your future with budgeting and forecas... Read more
Financial Modeling Analysis
The main purpose of the model is to allows user to easily compare the financial performance result f... Read more
Comprehensive Business Valuation Model with Free P...
The report is detailed and easy template which allow the user to determine and monitor the value of ... Read more
Private Equity Fund Model (Investor Cashflows)
Private Equity Financial Model to analyze fund cashflows and returns available to Limited Partners (... Read more
All My Financial Models, Spreadsheets, Templates, ...
Lifetime access to all future templates as well! Here is a set of spreadsheets that have some of the... Read more
Advanced Financial Model with DCF & Valuation
General Overview Advanced Financial Model suitable for any type of business/industry and fully cu... Read more
Startup Company Financial Model – 5 Year Fin...
Highly-sophisticated and user-friendly financial model for Startup Companies providing a 5-Year adva... Read more
Franchisor Licensing: Financial Model with Cap Tab...
Build up to a 10 year financial forecast with assumptions directly related to the startup and operat... Read more
3 Statement Financial Modeling with DCF & Rel...
Financial Modeling Tutorial guides user via step by step approach on how to build financial models w... Read more
Due Diligence P&L – Exhaustive Revenue a...
Model for in depth understanding of high level profit and loss and revenue analysis. Big-4 like chec... Read more
You must log in to submit a review.


