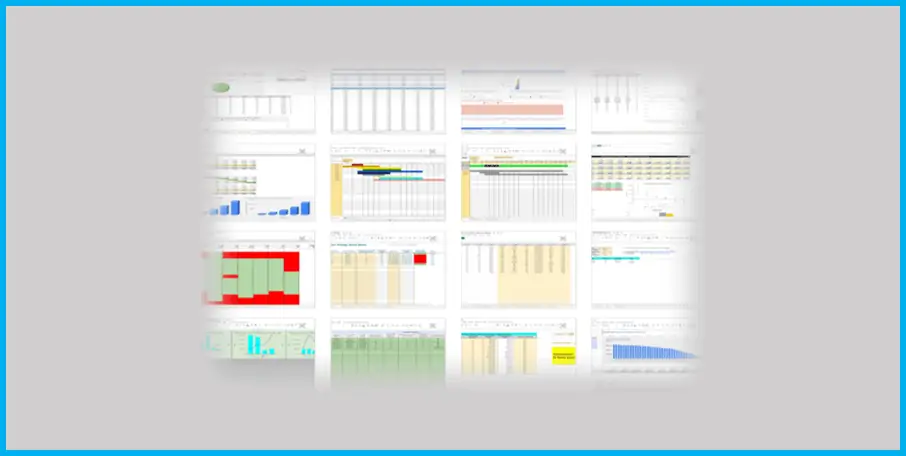
KPI Dashboard – Sales Tracking
A KPI dashboard in Excel that has a lot of dynamic functions and tracking features for various items that you may have on a given invoice.

| Financial Model, General Excel Financial Models |
| CFO, Dashboard, Excel, Financial Planning, Invoice Analysis, KPIs (Key Performance Indicators), Sales Tracking |
Video Tutorial:
KPI Dashboard – Tracking Invoices/Data Points/Salesmen/Products
Two database entry tabs drive this KPI dashboard. You will be able to track the total sales/outstanding/paid amounts across all invoices over any time frame and charted daily for any 365 days of time. This 365-day tracking also goes for product sales and 10 other organization measures (data points) that you may want to track on a daily basis.
A query function is also added to look at any individual invoice to see what is owed/paid.
One of the more interesting chart tracking features is the ability to see revenue by customer type as well as by service type.
Video tutorial available.
Similar Products
Other customers were also interested in...
All My Financial Models, Spreadsheets, Templates, ...
Lifetime access to all future templates as well! Here is a set of spreadsheets that have some of the... Read more
Top 16 Google Sheet Templates
This is a bundle of all the most useful and efficient google sheet templates I have built over the y... Read more
Joint Venture and Fund Cash Flow Waterfall Templat...
Here are all the spreadsheets I've built that involve cash flow distributions between GP/LP. Include... Read more
Preferred Equity Cash Distribution Model – 2...
A 10-year joint venture model to plan out various scenarios for the way cash is shared between a GP ... Read more
Cumulative LP Distribution Joint Venture Waterfall...
A 6 Tier cash flow waterfall template. Plug in the distributable cash flow (+/-) and set the hurdle ... Read more
Franchisor Licensing: Financial Model with Cap Tab...
Build up to a 10 year financial forecast with assumptions directly related to the startup and operat... Read more
Cost Segregation Study: Estimated Benefit Summary ...
This calculator has inputs for many different asset categories and their resulting recovery periods.... Read more
Investment Fund Preferred Return Tracker: Up to 30...
Track preferred returns for investors in a fund with this template. Premium joint venture tracking t... Read more
Cash Flow Waterfall with GP / Sponsor Catch-up Pro...
Offers logic to demonstrate the option to catch up the GP on their IRR after the LP earns their firs... Read more
Small Business Playbook (Financial / Tracking Temp...
About the Template Bundle: https://youtu.be/FPj9x-Ahajs These templates were built with the ... Read more
You must log in to submit a review.


