Financial Modeling Analysis
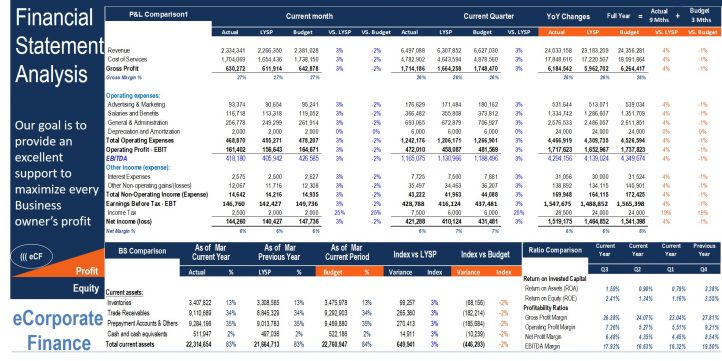
The main purpose of the model is to allows user to easily compare the financial performance result from one period to the next or between actual and budget without having to look at multiple financial statements
General overview
The main purpose of the model is to allow the user to easily compare the financial performance result from one period to the next or between actual and budget without having to look at multiple financial statements,
This information is the business intelligence decision-makers use for determining future business decisions, and to make changes to steer your company towards more profitability and efficiency,
Financials and investors can easily look at the variance column to pinpoint the reason behind the changes,
The model provides an extensive financial analysis comparison and has designed to be useful tools for beginners and advanced financial professionals.
Very simple to use, the user only needs to fill the green cells in the green tabs and the outputs are updated instantly
So a quick overview of the model, in the contents sheet you can see the structure of the model, and by clicking on any of the headlines will automatically be redirected to the relevant sheet
Key inputs in the green tabs
Update the general info in the orange tab
Identify the fiscal year by choosing the selection box in the “P&L Trend” tab under column B, row 3
Select the current month on a monthly basis by choosing the selection box in the “P&L Trend” tab under column B, row 5
All cells in green are input cells
You can find the green cells in the green tabs only
You will get the outcome in the dark blue tabs
You can read the instruction in the light blue tab
Key outcome in the dark blue tabs
The inputs in the green cells will dynamically flow into the following below:
-3 financial statements by month
-Monthly ratios trend
-P&L Actual vs LYSP and budget for the current month
-P&L Actual vs LYSP and budget year to date
-P&L Actual vs LYSP and budget for the current quarter by choosing the selection box under column B,row5
-P&L full year vs previous year and budget
-P&L comparison for the last 4 quarters by choosing the selection box under column B, row 5
-Balance sheet comparison actual current period vs last year same period and budget
-Cash flow comparison for the current month
-Cash flow comparison year to date
-Ratios comparison for the last 4 quarters by choosing the selection box under column B, row 5
-Strategical plan for 10 year
-Business valuation and analysis
-Dashboard summary
Conclusion and customization
Highly versatile, very sophisticated financial template and friendly user
If you have any inquiry, modification or to customize the model for your business please reach me through: [email protected]
Similar Products
Other customers were also interested in...
Corporate Finance Toolkit – 24 Financial Mod...
They are essential models to increase your productivity, plan your future with budgeting and forecas... Read more
Comprehensive Business Valuation Model with Free P...
The report is detailed and easy template which allow the user to determine and monitor the value of ... Read more
Private Equity Fund Model (Investor Cashflows)
Private Equity Financial Model to analyze fund cashflows and returns available to Limited Partners (... Read more
All My Financial Models, Spreadsheets, Templates, ...
Lifetime access to all future templates as well! Here is a set of spreadsheets that have some of the... Read more
Advanced Financial Model with DCF & Valuation
General Overview Advanced Financial Model suitable for any type of business/industry and fully cu... Read more
Due Diligence P&L – Exhaustive Revenue a...
Model for in depth understanding of high level profit and loss and revenue analysis. Big-4 like chec... Read more
Startup Company Financial Model – 5 Year Fin...
Highly-sophisticated and user-friendly financial model for Startup Companies providing a 5-Year adva... Read more
3 Statement Financial Modeling with DCF & Rel...
Financial Modeling Tutorial guides user via step by step approach on how to build financial models w... Read more
Franchisor Licensing: Financial Model with Cap Tab...
Build up to a 10 year financial forecast with assumptions directly related to the startup and operat... Read more
Small Business Playbook (Financial / Tracking Temp...
About the Template Bundle: https://youtu.be/FPj9x-Ahajs These templates were built with the ... Read more
You must log in to submit a review.


