Family Service Financial Model Excel Template
Get Your Family Service Financial Model. Create fully-integrated financial projection for 5 years. With 3 way financial statements inside. Five year family service 3 way forecast for fundraising and business planning for startups and entrepreneurs. Key financial charts, summaries, metrics, and funding forecasts built-in. Created with the mind of the family service business. Use Family Service Financial Projection Model before acquiring family service business, and get funded by banks or investors. Unlocked – edit all – last updated in Sep 2020. No matter where you are in the business development stage, a sophisticated financial projection model for the family service will help you. Excel knowledge or financial planning experience is NOT required!

NOTE: Single-User pertains to a limited Single User License where the template can only be used by one single user; while Multi-User is a license for users sharing the template with up to 20 members. Please refer to Terms of Use and License and Permitted Use for clarification.
FAMILY SERVICE EXCEL PRO FORMA TEMPLATE KEY FEATURES
Video tutorial:
Gaining trust from stakeholders
Investors and financing providers tend to think in terms of the big picture. They want the c-level of the companies they invest in to do the same to ensure they maintain a clear idea of the future. Providing stakeholders with a monthly projected cashflow statement will demonstrate a level of awareness that leads to confidence and trust and will make it easier to raise more investment.
Prove You Can Pay Back the Loan You Requested
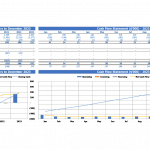
When you apply for a business loan, bankers will study your Startup Cash Flow Projection in an attempt to answer this question: Can this business pay back the loan? Requesting a loan without showing your Cashflow Forecast for paying it back is a common way to land in the rejection pile. It is exceptionally accurate if your current cash flow won’t cover all of your monthly operating expenses — plus your loan payment. Don’t fall into this kind of situation. Use Cash Flow Statement Proforma to strengthen your case by showing the banker exactly how you plan to use the loan and when you will start repaying the debt. This type of forecasting helps you create a road map that can impress a lender with the confidence they need to approve your loan.
5 years forecast horizon
Generate fully-integrated Family Service Three Statement Financial Model for 5 years (on a monthly basis). Automatic aggregation of annual summaries on outputs tabs.
Get a robust, powerful financial model which is fully expandable
This well-tested, robust and powerful Family Service Cash Flow Format In Excel is your solid foundation to plan family service business model. Advanced users are free to expand and tailor all sheets as desired, to handle specific requirements or to get into greater detail.
Confidence in the future
Using our financial model, you can effectively plan, prevent risks, manage stocks and Cash Flow Statement For 5 Years and foresee your prospects for the next 5 years.
Save Time and Money
Family Service Budget Financial Model allows you to start planning with minimum fuss and maximum of help. No writing formulas, no formatting, no programming, no charting, and no expensive external consultants. Plan the growth of your business instead of fiddling around with expensive techy things.
REPORTS and INPUTS
All in One Place
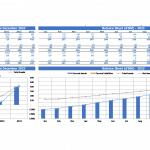
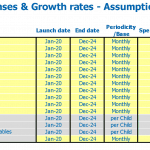
This Family Service Pro Forma Budget will give the entrepreneurs financial assumptions regarding costs and income that can be brought together to get the business’s full picture.
Top Revenue
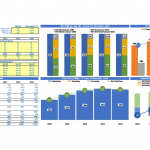
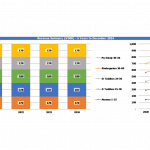
This Excel Financial Model has a tab for a detailed analysis of the company’s revenue streams. With this template, users can analyze the revenue streams by each product or service category separately.
Profitability KPIs
Internal rate of return (IRR). An internal rate of return or IRR is the interest rate or such type of a discount rate that yields a net present value of the net cash flow stream from different kinds of investments and actions. IRR financial metric is very important for investors and analysts. IRR is usually shown as a percentage.
Operational KPIs
Our Family Service Financial Model Excel has various operational performance graphs that will help business owners manage their business’ finances and measure their overall performance. These operational performance graphs also help in making wise business decisions that consider the company’s financial capability.
The financial graphs in this Family Service Pro Forma Projection help measure the company’s financial health showing the operating cash flows’ analysis, return on investment, debt to equity ratio, liquidity ratios, and other relevant financial information. Business owners can use these operational performance graphs both for internal and external purposes.
In particular, they can use these graphs to assess the company’s overall financial performance or for the assessment of the project’s financial feasibility. Such an approach will improve the financial management efficiency of the company. Business owners can also use these charts and graphs for the presentations for potential investors and bankers. The operational performance graphs have all the necessary pre-built formulas, and they are fully formatted. So, the users can just print out them and bring for the meeting with investors.
Cash Flow KPIs
Cash balance. The cash balance shows the total amount of money in a financial account of the company. Any company needs to hold in reserve enough amount of cash to meet current obligations.
CAPEX
A capital expenditure (CAPEX) reflects the company’s investment in a business. Such an investment can be made in a piece of manufacturing equipment, an office supply, a vehicle, or others.
A CAPEX is typically steered towards the goal of rolling out a new product line or expanding a company’s existing operations. The company does not report the money spent on CAPEX purchases directly in the profit and loss projection. It reflects these expenses as an asset in the balance sheets and, at the same time, deducts a part of this amount in the form of depreciation expenses for several years.
Top Expenses
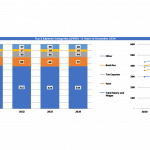
The Top expenses tab of the Family Service Pro Forma Projection reflects your company’s annual expenses, both total and grouped by four categories.
This Financial Projection Model Template provides an overview of annual expenses on customer acquisition, COSS placeholders, wages & salaries, fixed and variable expenses, and all other expenses.
File types:
Excel – Single-User: .xlsx
Excel – Multi-User: .xlsx
Free Demo – .xlsx
Similar Products
Other customers were also interested in...
Infant Care Financial Model Excel Template
Impress bankers and investors with a proven, solid Infant Care Financial Projection Template. Genera... Read more
Pre-School Care Financial Model Excel Template
Get the Best Pre-School Care Financial Projection Template. Creates a financial summary formatted fo... Read more
Child Care Financial Model Excel Template
Try Child Care Pro Forma Projection. Simple-to-use yet very sophisticated planning tool. Get reliabl... Read more
In-Home Daycare Financial Model Excel Template
Purchase In-Home Daycare Financial Plan. Spend less time on Cash Flow forecasting and more time on y... Read more
Baby Minding Financial Model Excel Template
Get Baby Minding Financial Model Template. Simple-to-use yet very sophisticated planning tool. Get r... Read more
Babysitting Financial Model Excel Template
Discover Babysitting Financial Projection Template. Use this Excel to plan effectively, manage Cash ... Read more
Online Tutoring Services Financial Model (10+ Yrs ...
The Online Tutoring Services Financial Model is a comprehensive tool designed to analyze the financi... Read more
Start Up Nursery School Financial Model
Start Up Nursery School Financial Model presents the case of an investment in a nursery school and i... Read more
Foreign Languages School – 5 Year Financial Mode...
Financial Model providing an advanced 5-year financial plan for a startup or operating Foreign Langu... Read more
Driving School – 5 Year Financial Model
Financial Model providing an advanced 5-year financial plan for a startup or operating Driving Schoo... Read more
You must log in to submit a review.


