Direct Marketing Agency Financial Model Excel Template
Order Direct Marketing Agency Financial Model. Allows you to start planning with no fuss and maximum of help Direct Marketing Agency P&L Projection for startups or established companies is the right choice when they need to raise funds from investors or bankers and calculate funding requirements, make cash flow projections, develop budgets for the future years, or to enhance a business plan. Used to evaluate a direct marketing agency business before selling it. Unlocked – edit all – last updated in Sep 2020. The direct marketing agency pro forma budget includes all necessary forecasting reports, includes industry-specific assumptions, projected income statement (profit and loss pro forma), cash flow forecast, startup valuation, performance KPIs, and financial summaries for months and years (incl. numerous graphs and KPIs).

NOTE: Single-User pertains to a limited Single User License where the template can only be used by one single user; while Multi-User is a license for users sharing the template with up to 20 members. Please refer to Terms of Use and License and Permitted Use for clarification.
DIRECT MARKETING AGENCY PRO FORMA TEMPLATE KEY FEATURES
Video tutorial:
Simple and Incredibly Practical
Simple-to-use yet very sophisticated Direct Marketing Agency Financial Projection Template Excel. Whatever size and stage of development your business is, with minimal planning experience and very basic knowledge of Excel you can get complete and reliable results.
Plan for Future Growth
Cash Flow Statement Proforma can help you plan for future growth and expansion. No matter you’re extending your company with new employees and need to take into account increased staff expenses. Or to scale production to keep up with increased sales, future projections help you see accurately where you’re running — and how you’ll get there. Forecasting is also a well-known goal-setting framework to help you plan out the financial steps your company has to take to reach targets. There’s power in Cash Flow Statement Proforma and the insight they can provide your business. Fortunately, this competitive advantage comes with little effort when you use the Projected Cash Flow Statement Format.
Generate growth inspiration
By running various scenarios and looking at the effects they could have on your cash balance, you will begin to see which options are best for your business. Ones that are possible, and what is involved in making them work. Organic growth isn’t the only option – there are growing funding options becoming available, and Cash Flow Statement Proforma could be a way of looking at the impact an injection of cash could have on your business and its growth plans.
Track your spending and staying within budget
Have you written a vague idea of cash inflows and cash outflows on the back of a napkin? All is well and good. Looking at the projected p&l statement will give you a snapshot of the past business performance, but it won’t show the future in terms of the Cash Flow Statement For 5 Years. With a pro forma cash flow projection, you can plan future cash inflows and cash outflows and compare it to the budget, which can be invaluable information.
Save time and money
Via Excel Pro Forma you can without effort and special education get all the necessary calculations and you will not need to spend money on expensive financial consultants. Your task is building a strategy, evolution, and creativity, and we have already done the routine calculations instead of you.
Save Time and Money
Direct Marketing Agency Financial Projection Model allows you to start planning with minimum fuss and maximum of help. No writing formulas, no formatting, no programming, no charting, and no expensive external consultants. Plan the growth of your business instead of fiddling around with expensive techy things.
REPORTS and INPUTS
Dashboard
Our Excel Pro Forma has an all-in-one dashboard. This dashboard is a useful financial planning tool that helps financial professionals create fast, reliable, and transparent financial reports to the management and other company’s stakeholders.
With this financial dashboard’s help, users can assess the company’s financial data, drill into financial details, or validate figures fast and easy. Our specialists understand that the company’s financial management, especially the start-up’s management, is under pressure to deliver fast decisions and results. This all-in-one financial dashboard is an effective financial tool that will help with these tasks.
With this dashboard, you will get data at your fingertips. You will be able to perform financial analysis, assess key performance indicators (KPIs), and other financial information you may need to generate actionable insights and make wise financial decisions.
Top Expenses
In the Top expenses section of our Direct Marketing Agency 3 Way Forecast, you can track your more significant expenses divided into four categories. The model also has an ‘other’ category, and you can expand or change this table according to your needs.
You can reflect your company’s historical data or make a Excel Pro Forma for the five years.
Operational KPIs
Our Direct Marketing Agency Budget Spreadsheet has various operational performance graphs that will help business owners manage their business’ finances and measure their overall performance. These operational performance graphs also help in making wise business decisions that consider the company’s financial capability.
The financial graphs in this Direct Marketing Agency Startup Financial Model help measure the company’s financial health showing the operating cash flows’ analysis, return on investment, debt to equity ratio, liquidity ratios, and other relevant financial information. Business owners can use these operational performance graphs both for internal and external purposes.
In particular, they can use these graphs to assess the company’s overall financial performance or for the assessment of the project’s financial feasibility. Such an approach will improve the financial management efficiency of the company. Business owners can also use these charts and graphs for the presentations for potential investors and bankers. The operational performance graphs have all the necessary pre-built formulas, and they are fully formatted. So, the users can just print out them and bring for the meeting with investors.
Financial Statements
Our Direct Marketing Agency Profit Loss Projection has a pre-built integrated financial statement structure that contains all the primary financial statements (Balance sheet, profit and loss projection, and cash flow forecast) and creates financial forecasts for the next five years automatically.
This integrated financial statement structure has pre-built proformas, financial and managerial reports, and financial ratios. Users can choose the presentation of financial information in GAAP or IFRS format for their convenience.
Burn and Runway
The cash burn rate shows the difference between the cash inflows and cash outflows of the company. It is essential to monitor this metric because it shows how long the company will last with its current funding level. Business owners can also see a clear picture of how various business strategies change the cash burn rate.
Liquidity KPIs
Accounts receivable turnover (ART). In the Financial Model In Excel, the accounts receivables turnover ratio (ART) calculates a metric that assesses a company’s effectiveness in collecting its receivables. This ratio shows how successful the company is in managing its debts.
Top Revenue
This Financial Projection Template has a tab for a detailed analysis of the company’s revenue streams. With this template, users can analyze the revenue streams by each product or service category separately.
File types:
Excel – Single-User: .xlsx
Excel – Multi-User: .xlsx
Free Demo – .xlsx
Similar Products
Other customers were also interested in...
Content Marketing Agency Financial Model Excel Tem...
Buy Content Marketing Agency Financial Model Template. Enhance your pitches and impress potential in... Read more
Traditional Advertising Agency Financial Model Exc...
Discover Traditional Advertising Agency Financial Projection Template. Allows you to start planning ... Read more
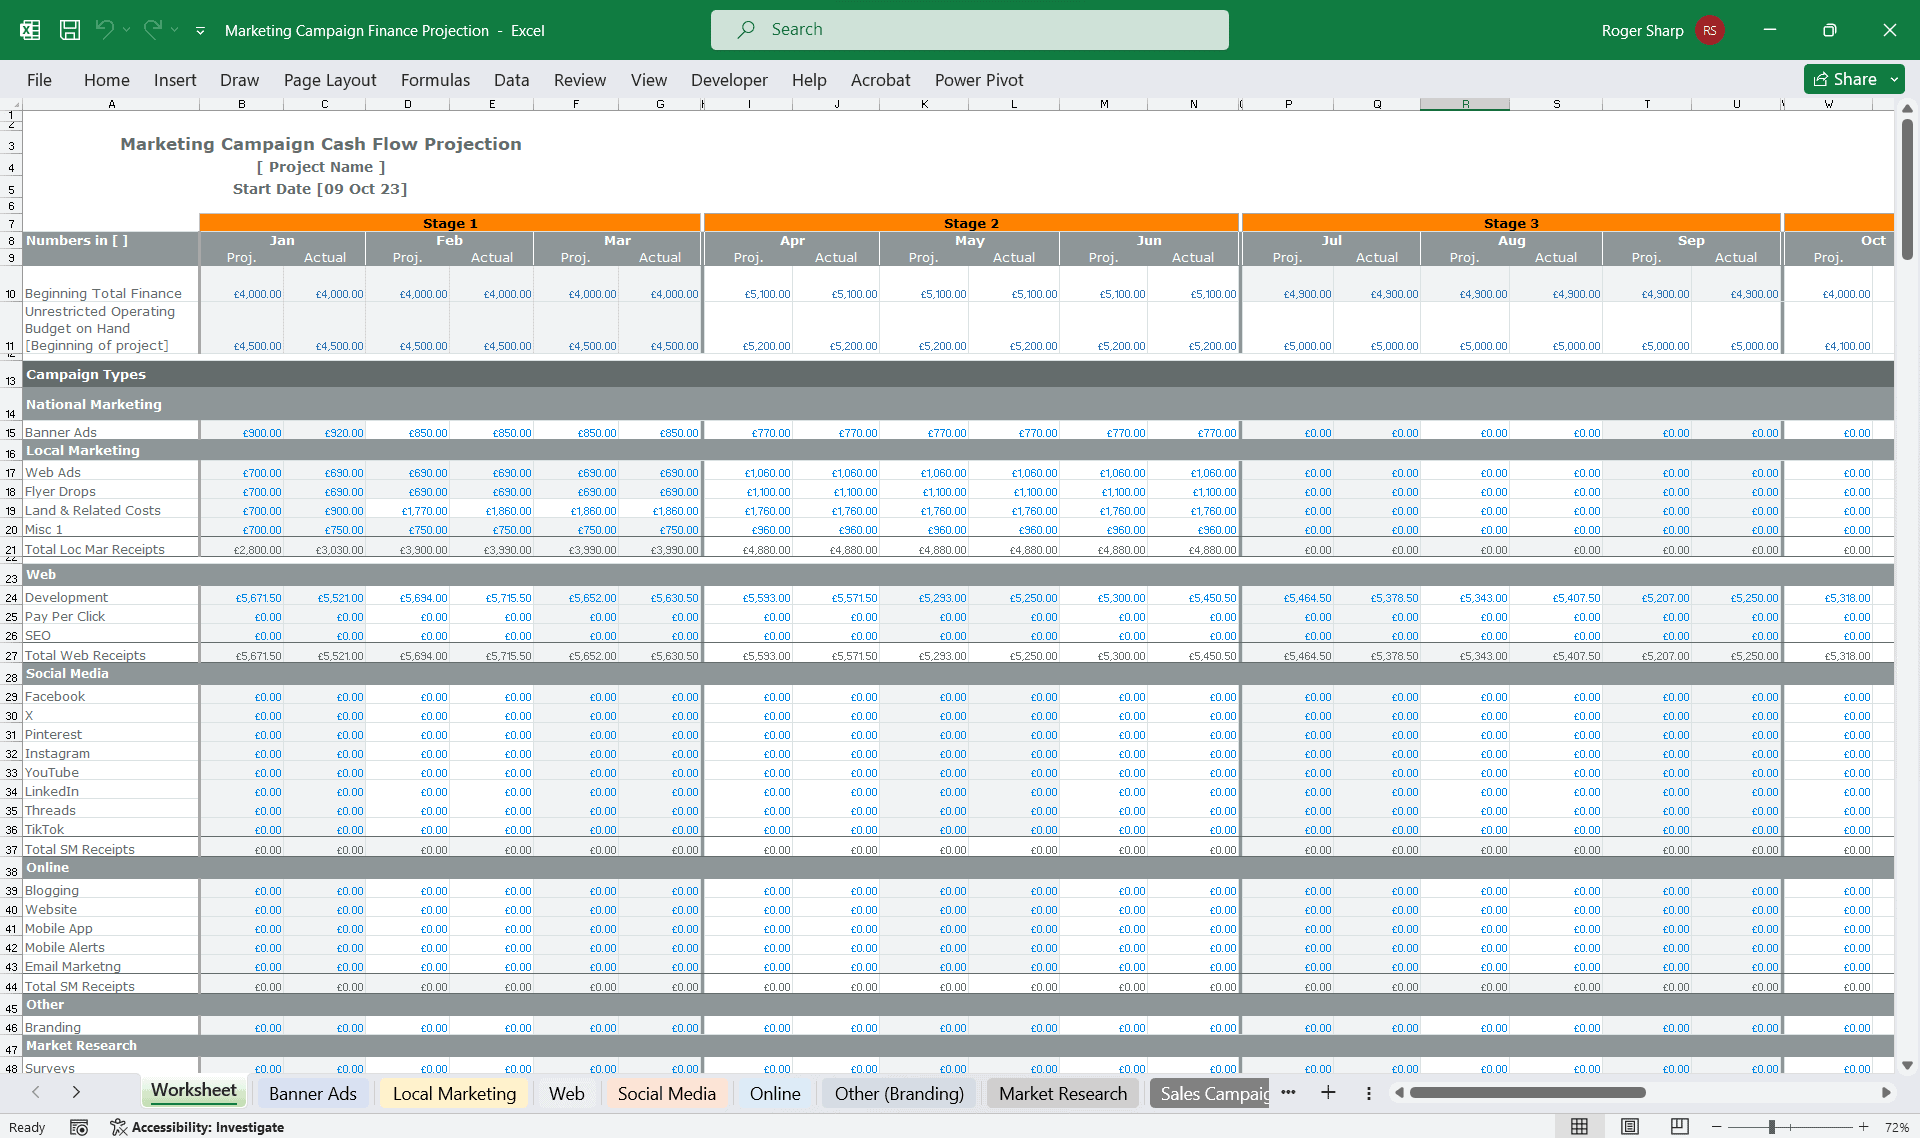
Marketing Campaign Financial Projection Model
Comprehensive editable, Excel spreadsheet for tracking marketing campaign financials in months or st... Read more
Digital Marketing Agency Financial Model Excel Tem...
Check Our Digital Marketing Agency Financial Projection Template. Excel Template for your pitch deck... Read more
Email Marketing Agency Financial Model Excel Templ...
Check Email Marketing Agency Financial Model Template. Allows you to start planning with no fuss and... Read more
Social Media Agency Financial Model Excel Template
Check Social Media Agency Financial Model. Creates 5-year Pro-forma financial statements, and financ... Read more
Photography Studio Financial Model Excel Template
Discover Photography Studio Financial Projection Template. Fortunately, you can solve Cash Flow shor... Read more
Youtube Content Creator Financial Model Excel Temp...
The UPtick Youtube Content Creator Template is a simple yet robust financial model that allows you t... Read more
Digital Media Financial Model Excel Template (Full...
The UPtick Digital Media Template is a simple yet robust financial model that allows you to make int... Read more
Branding Agency Financial Model Excel Template
Get the Best Branding Agency Financial Projection Template. Fortunately, you can solve Cash Flow sho... Read more
You must log in to submit a review.


