Budget to Actual Comparison
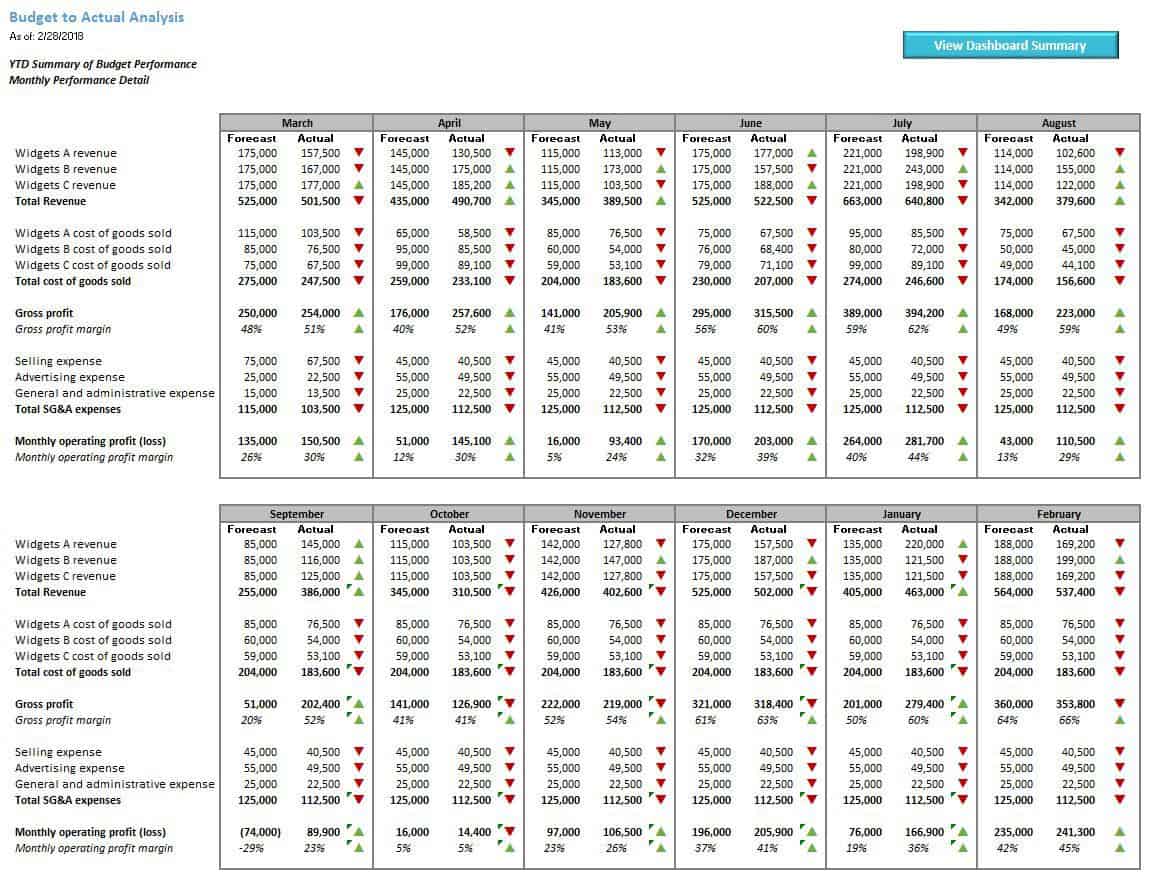
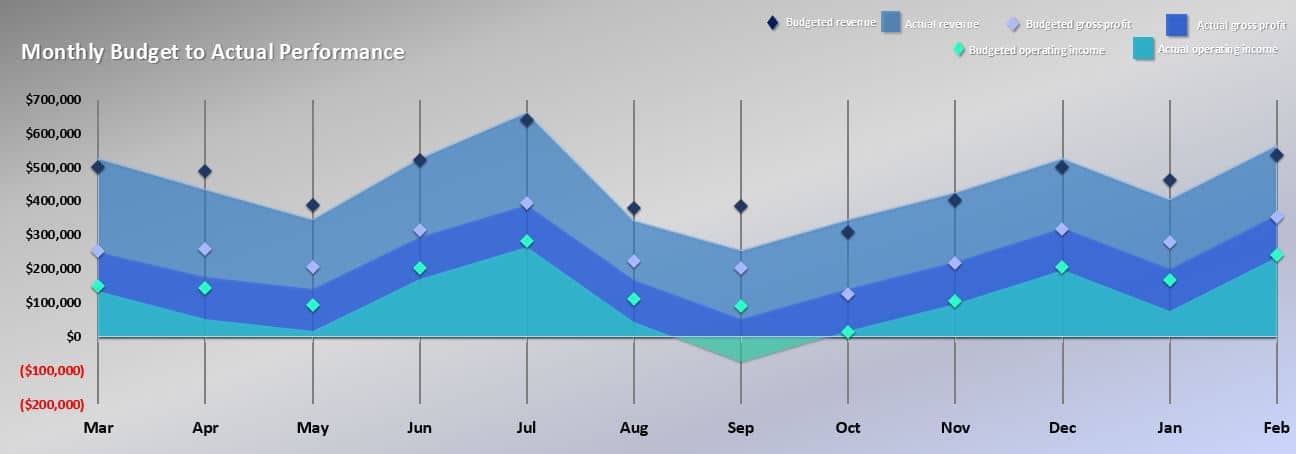
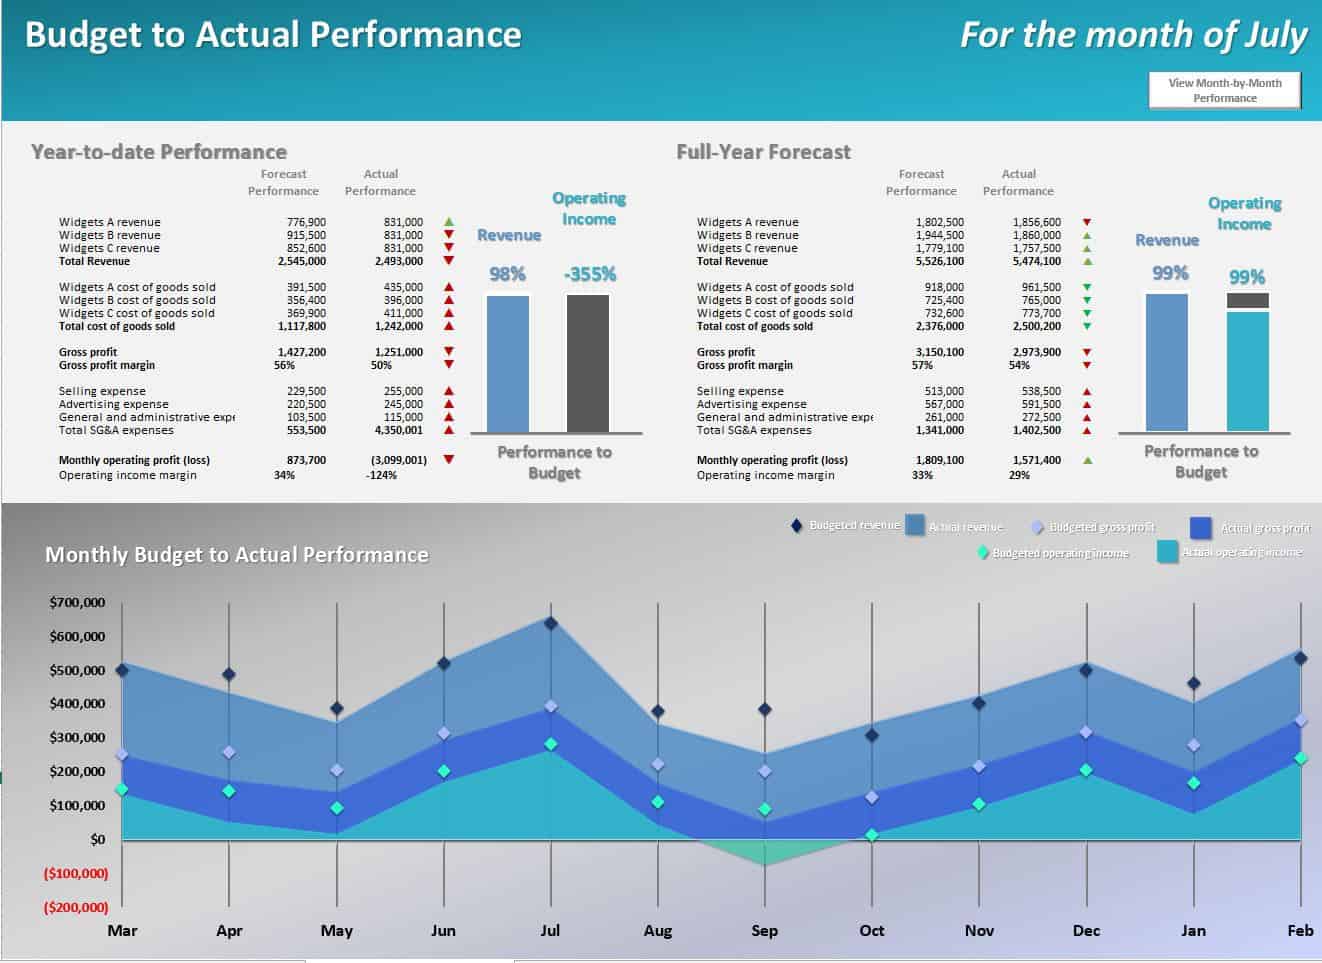
This monthly budget-to-actual dashboard allows for at-a-glance performance analysis. In addition to analyzing YTD performance, it also provides a revised forecast for the year based on actual performance to date and budgeted performance for the remainder of the year. The dashboard features an analysis of each month’s performance relative to budget for revenue, gross profit and operating income while a supplementary detailed monthly analysis shows performance of revenue, cost of sales and operating expense categories.

| All Industries, General Excel Financial Models |
| Accounting, Budgeting, CFO, Excel, Financial Projections, Performance Tracking, Variance Analysis |
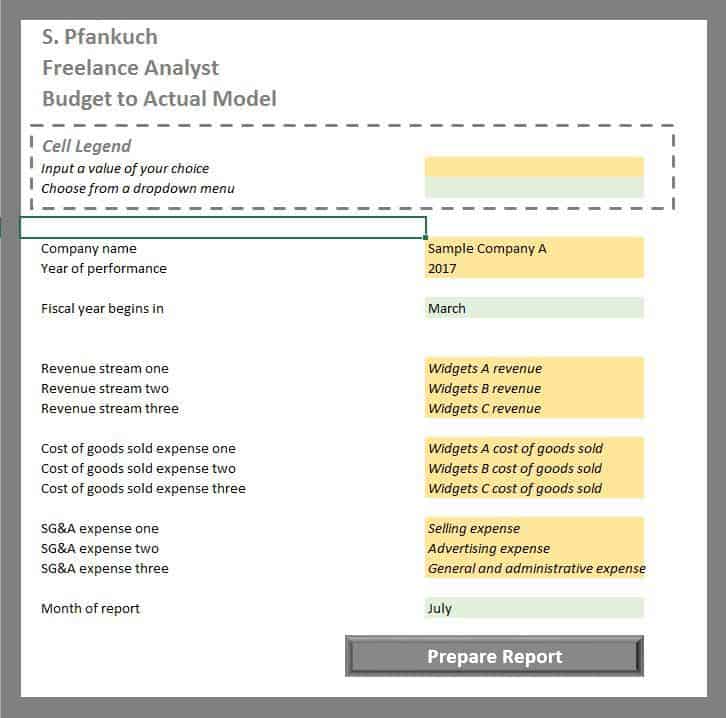
This monthly budget-to-actual dashboard allows for at-a-glance performance analysis. With a flexible design allowing for up to three revenue, cost of sales, and operating expense categories each, you can quickly customize it for your business.
Only want to use one or two revenue or expense categories? Just enter “do not use” as the title, and the model will make all of the changes.
The model features an easy input screen feeding the analyses and adjusts for your fiscal year. Simply enter your revenue and expense categories on the control panel, choose the month that you want to display the analysis for, and proceed to enter the budget and actual values for each month.
Budget values can be entered at one time, while actual values can be entered every month. Once entry is complete, the dashboard will show an analysis of all expense categories on a YTD basis, comparing actual performance to budget performance. It will highlight the percentage of budgeted revenue and operating income achieved to date.
The model will also calculate a revised forecast for the full year, using actual performance to date and budgeted performance for the remaining months. Below this analysis, the dashboard shows monthly performance to budget based on revenue, gross profit, and operating income.
For a more detailed report, the model includes a detailed monthly analysis of the performance of all revenue and expense categories to budget. 


Similar Products
Other customers were also interested in...
Coffee Shop Financial Model Excel Template
Download Coffee Shop Financial Model Template. Allows you to start planning with no fuss and maximum... Read more
Electric Vehicle (EV) Charging Station Financial M...
With this comprehensive 5- or 10-year monthly tool, investors can assess the viability of setting up... Read more
Financial Model for Mobile App | Mobile App Busine...
The Mobile App Financial Plan Template in Excel allows you to develop financial projections when lau... Read more
Food Truck Financial Model Excel Template
Purchase Food Truck Financial Projection Template. Excel Template for your pitch deck to convince In... Read more
Green Hydrogen Production from Wind Energy Financi...
The Green Hydrogen from Wind Financial Model aims to comprehensively forecast a horizon of 40 years ... Read more
Simple Mutual Non-Disclosure Agreement Template
Protect your business secrets with ease using our Simple Mutual Non-Disclosure Agreement Template. S... Read more
Solar Energy Financial Model
The Solar Energy Financial Model Excel template forecasts the expected financials for a Solar Park p... Read more
The Customer-Centric Financial Model for Restauran...
Starting a restaurant without a financial plan is like driving a car blindfolded. You wouldn´t do i... Read more
Reviews
I need this sheet in my work
Thank you for your feedback.
272 of 534 people found this review helpful.
You must log in to submit a review.


