Breakfast Restaurant Financial Model Excel Template
Order Breakfast Restaurant Financial Projection Template. Allows you to start planning with no fuss and maximum of help Five-year horizon financial model in excel template for the breakfast restaurant business for early-stage startups to impress investors and raise capital. Breakfast Restaurant Pro Forma Budget helps you evaluate your startup idea and/or plan a startup costs. Unlocked – edit all – last updated in Sep 2020. A robust breakfast restaurant financial projection excel tool. No matter size or startup development stage are, with minimal financial planning experience and basic knowledge of Excel you can build a complete financial plan.

NOTE: Single-User pertains to a limited Single User License where the template can only be used by one single user; while Multi-User is a license for users sharing the template with up to 20 members. Please refer to Terms of Use and License and Permitted Use for clarification.
BREAKFAST RESTAURANT FINANCIAL PROJECTION TEMPLATE KEY FEATURES
Video tutorial:
Update anytime
You can easily adjust inputs at the launch stage and throughout the further activities of your business to refine your Breakfast Restaurant Profit Loss Projection.
External stakeholders, such as banks, may require a regular forecast.
If the business has a bank loan, the bank will ask for a Breakfast Restaurant Three Way Financial Model regularly.
Confidence in the future
Using our financial model, you can effectively plan, prevent risks, manage stocks and Cash Flow Statement By Month and foresee your prospects for the next 5 years.
Simple-to-use
A very sophisticated Breakfast Restaurant Financial Model, whatever size and stage of development your business is. Minimal previous planning experience and very basic knowledge of Excel is required: however, fully sufficient to get quick and reliable results.
Saves you time
Allows you to spend less time on Cash Flow Statement Projection and more time on your products, customers and business development
5 years forecast horizon
Generate fully-integrated Breakfast Restaurant Cash Flow Proforma Template for 5 years (on a monthly basis). Automatic aggregation of annual summaries on outputs tabs.
REPORTS and INPUTS
Burn and Runway
The cash burn rate shows the difference between the cash inflows and cash outflows of the company. It is essential to monitor this metric because it shows how long the company will last with its current funding level. Business owners can also see a clear picture of how various business strategies change the cash burn rate.
Cash Flow KPIs
Cash balance. The cash balance shows the total amount of money in a financial account of the company. Any company needs to hold in reserve enough amount of cash to meet current obligations.
Financial Statements
The template has a three-statement Financial Model Excel Template with integrated proformas. It allows users to create a company’s Balance Sheet, income statement projection, and a pro forma cash flow projection with minimum efforts. For these proformas, users can input either historical or forecasted financial data. Forecasted financial statements show how a company will perform under various circumstances and allow users to integrate different assumptions in the Financial Model.
For example, the company’s management can see the economic impact of its decisions, such as price changes.
Our well-built Breakfast Restaurant Financial Model Excel Spreadsheet shows stakeholders how the company’s functions work together and how management’s decisions impact its overall financial performance.
Operational KPIs
Financial graphs and charts in this Breakfast Restaurant Cash Flow Proforma help the stakeholders visually track liquidity, budgets, expenses, cash flow, and many other company financial metrics. These graphs will also help a company’s management avoid problems by reflecting its financial data in real-time, with a comprehensive financial information overview.
These operational performance graphs will help the business owners and financial managers ensure the best possible performance and financial health of their company because regular financial analytics procedures and the highest quality of financial data are the company’s top priorities.
Our financial graphs will also help the company’s financial specialists raise financial issues at the general meetings and deliver understandable financial information to other departments and external stakeholders.
Performance KPIs
Payback period. The cost of acquiring new customers should be compared to the profits that these customers generate. When these two numbers are divided, the result is called a payback period.
Valuation
With our Breakfast Restaurant 3 Way Financial Model Template, you will get proformas for valuation analysis. You will be able to perform a Discounted Cash Flow (DCF) valuation analysis and other valuations you may need.
Liquidity KPIs
Quick Ratio or Acid-Test Ratio. The quick ratio or acid-test ratio uses a firm’s balance sheet data to analyze if it has sufficient short-term assets to cover its short-term liabilities. This metric ignores less liquid assets like such as inventory.
Similar Products
Other customers were also interested in...
Cafe Financial Model Excel Template
Check Our Cafe Budget Template. Creates a financial summary formatted for your Pitch Deck. Ready to ... Read more
Gourmet Food Store Financial Model Excel Template
Gourmet Food Store Financial Model Allows you to start planning with no fuss and maximum of help . S... Read more
All-day Restaurant & Bar – 5 Year Financial ...
Financial Model providing advanced financial planning & analysis for an All-day Restaurant &... Read more
Pizzeria – 3 Statement Financial Model with ...
This Pizzeria business Plan Model is a perfect tool for a financial feasibility study on launching a... Read more
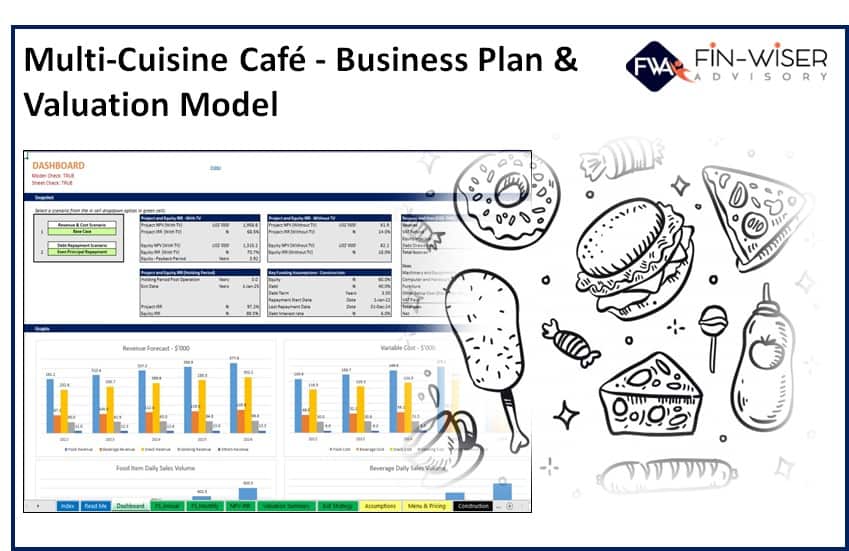
Multi Cuisine Cafe – 3 Statement Financial M...
This Multi-Cuisine Café business Plan Model is a perfect tool for a financial feasibility study on ... Read more
Golf & Entertainment Center – 5 Year Financi...
Financial Model providing an advanced 5-year financial plan for a startup or operating Golf & En... Read more
Restaurant Financial Model: Adaptable to all Types...
Our full-fledged financial model in excel format has the functionality to run unlimited activity sce... Read more
The Customer-Centric Financial Model for Restauran...
Starting a restaurant without a financial plan is like driving a car blindfolded. You wouldn´t do i... Read more
Karaoke Lounge Financial Model
The idea of this Karaoke Lounge Financial Model is, that you offer 3 separate Karaoke rooms for litt... Read more
Restaurant Financial Model
This Restaurant Financial Model is tailored for those who aim to start a business from scratch, and ... Read more
You must log in to submit a review.


