Array Formulas in Excel
Explains array formulas and shows how they can be used in financial analysis

|
|
| All Industries, General Excel Financial Models |
| eBook, Excel, Financial Modeling, Free Financial Model Templates, Tutorial |
My publication on this obscure to the many yet a useful and powerful area of Excel shows and explains how array formulas can help in financial analysis.
It starts with an overview of what array formulas are and how they are different from normal formulas. I am bringing in many useful tips about arrays: understanding vertical and horizontal arrays, generating arrays of consecutive integers, performing mathematical operations on arrays, using the F9 key to visualize arrays and debug formulas.
There is a distinction between single-cell and multi-cell array formulas. Multi-cell arrays are not so widely used in financial modeling but a professional analyst needs to be aware of such formulas.
‘Classic’ array formulas are committed to a cell with a combination of keys Ctrl+Shift+Enter (CSE). Yet in many cases, array formulas can be redesigned to work with a simple Enter. There are functions that can deal with arrays natively but there are also functions that will always require CSE or will never handle arrays.
Data tables are a special case of array formulas and I am giving an overview of this Excel feature.
The publication includes a number of practical examples using array formulas:
– calculating months inventory outstanding
– calculating the expected return of a portfolio containing many securities under several performance assumptions
– extending or shortening a ramp-up plan
– calculating XIRR with zero cash flow periods in the beginning
– working with dates
– transforming two-dimensional data
– and many else
In the end, I am giving miscellaneous tips concerning array formulas that you might not have heard of.
Similar Products
Other customers were also interested in...
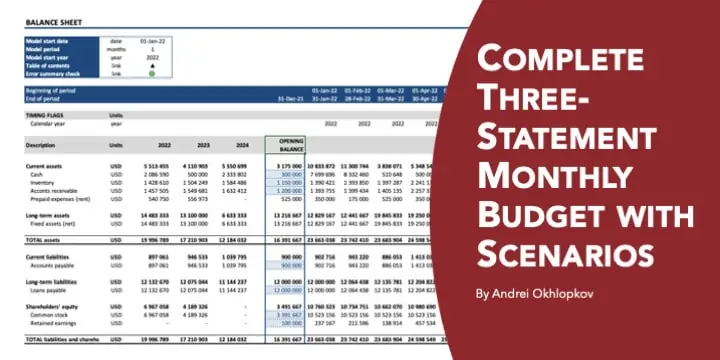
Complete Three-Statement Monthly Budget with Scena...
This is a comprehensive set of templates that will help you build your budget. The templates are bui... Read more
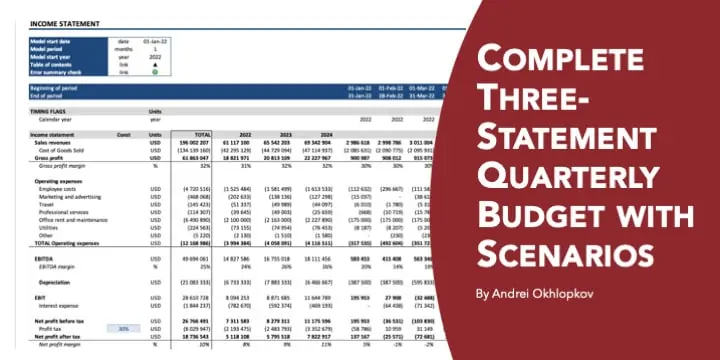
Complete Three-Statement Quarterly Budget with Sce...
This is a comprehensive set of templates that will help you build your budget. The templates are bui... Read more
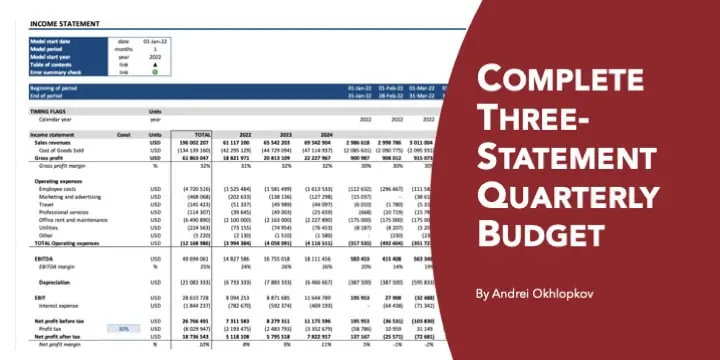
Complete Three-Statement Quarterly Budget
This is a comprehensive set of templates that will help you build your budget. The templates are bui... Read more
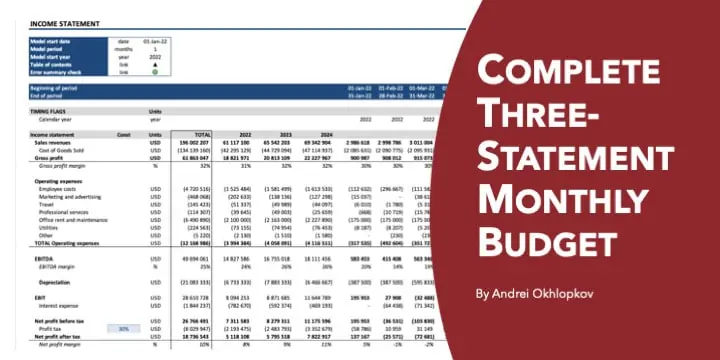
Complete Three-Statement Monthly Budget
This is a comprehensive set of templates that will help you build your budget. The templates are bui... Read more
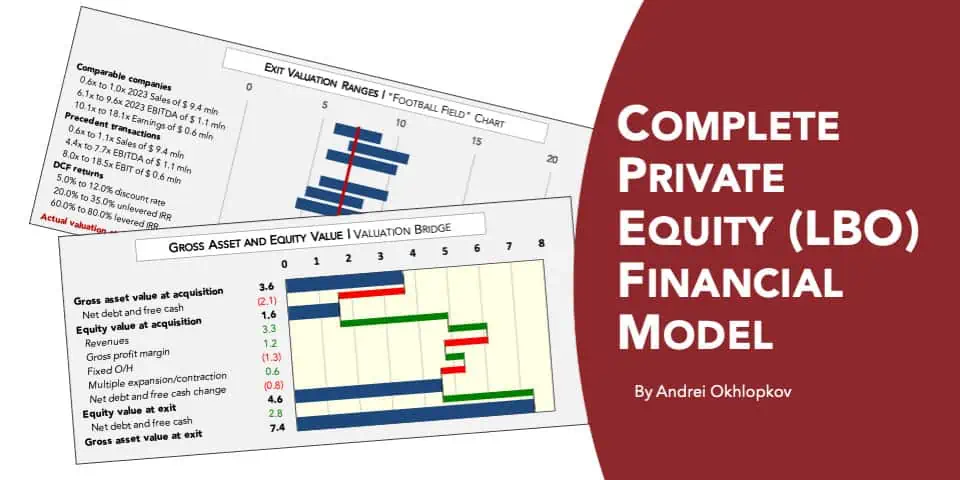
Complete Private Equity (LBO) Financial Model
This is a professional financial model which performs a thorough assessment of a private equity proj... Read more
Private Equity Fund Model (Investor Cashflows)
Private Equity Financial Model to analyze fund cashflows and returns available to Limited Partners (... Read more
All My Financial Models, Spreadsheets, Templates, ...
Lifetime access to all future templates as well! Here is a set of spreadsheets that have some of the... Read more
Advanced Financial Model with DCF & Valuation
General Overview Advanced Financial Model suitable for any type of business/industry and fully cu... Read more
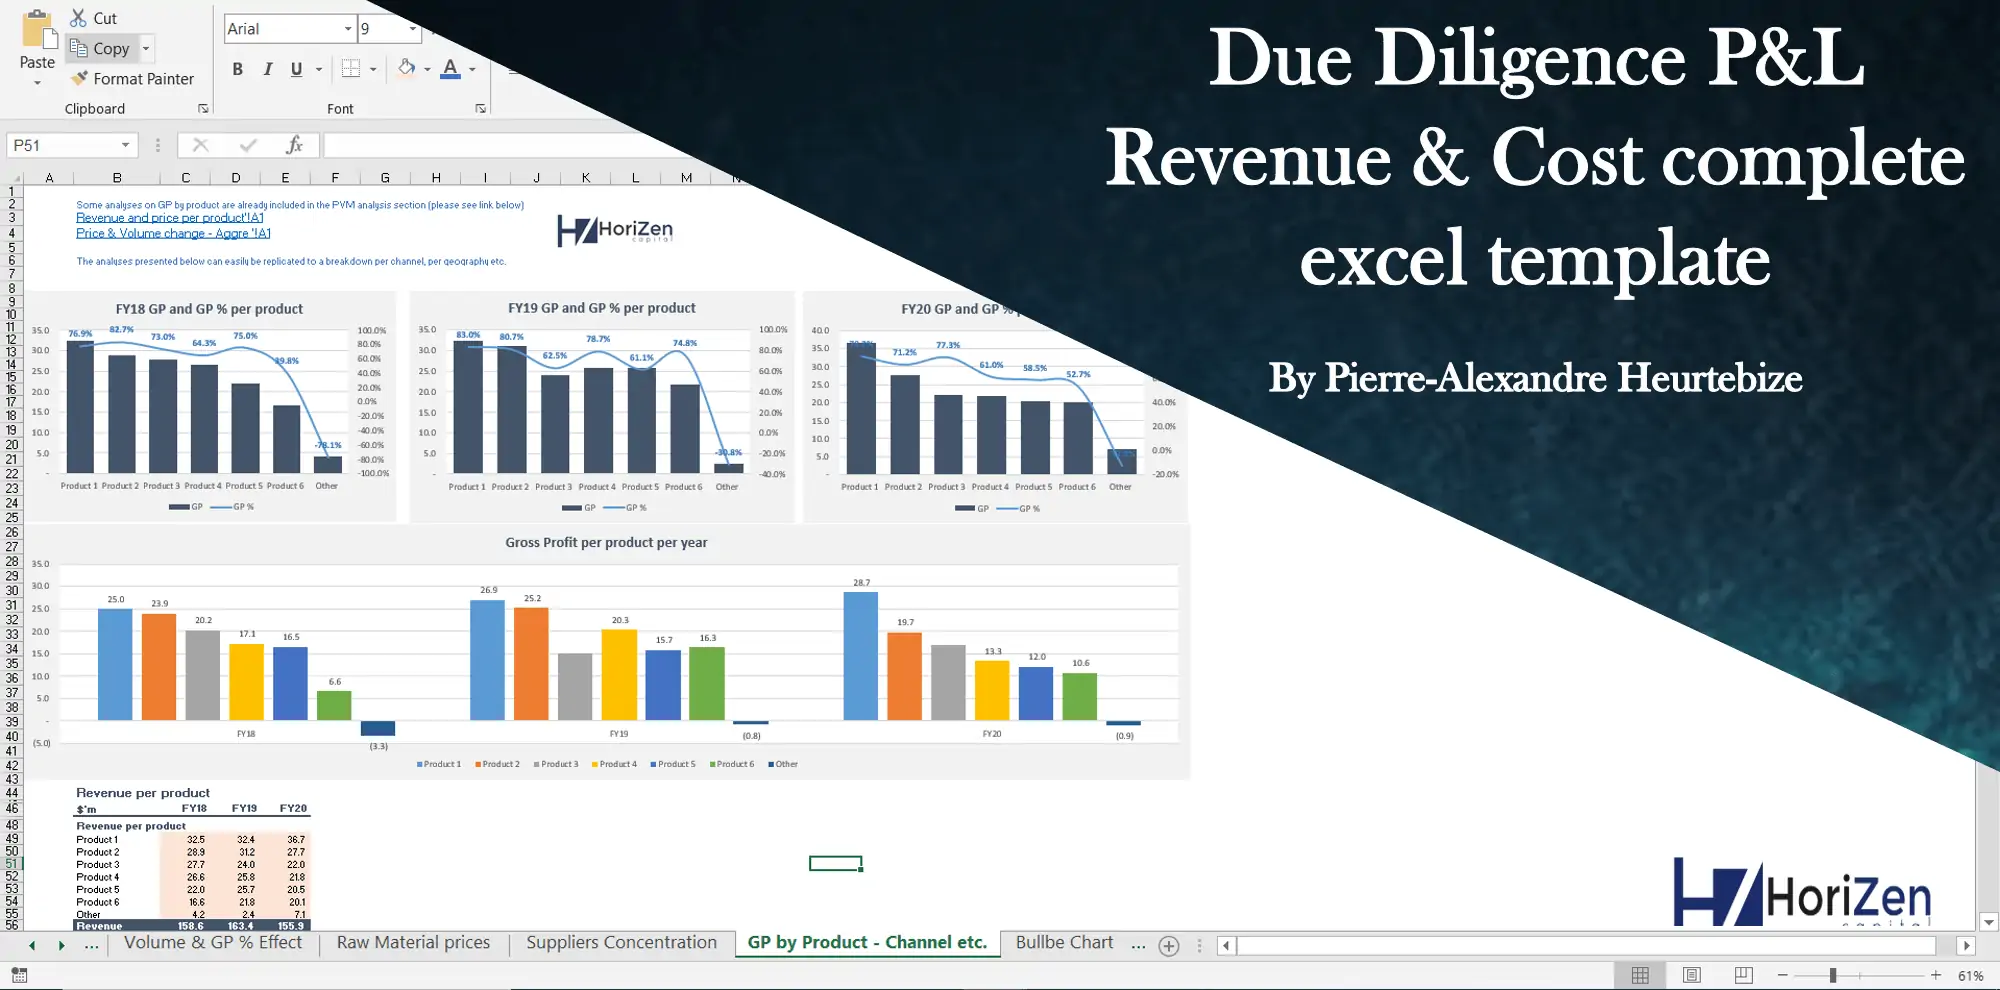
Due Diligence P&L – Exhaustive Revenue a...
Model for in depth understanding of high level profit and loss and revenue analysis. Big-4 like chec... Read more
Waterfall Profit Distribution Model (up to 4 Tiers...
We are introducing our 4-Tier Waterfall Profit Distribution Model. The waterfall profit distribution... Read more
You must log in to submit a review.


