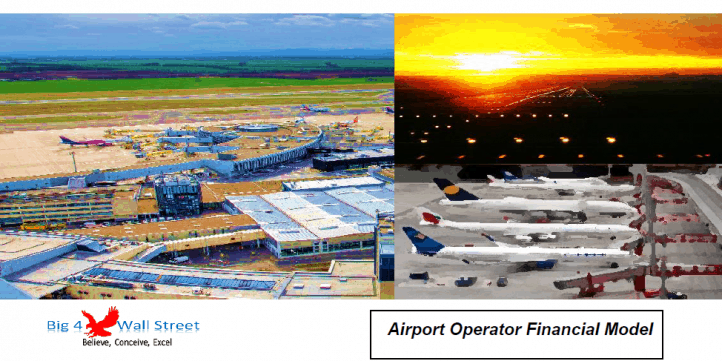
Airport Operator Financial Model
Airport Operator Financial Model presents the business case of an already operating airport (with planned refurbishments) and an investment in a new terminal in the same airport. The model generates the three financial statements as well as the cash flows and calculates the relevant metrics (Discounted cash flows, Net Present Value, Internal Rate of Return, payback period, cash on cash multiple, enterprise value, etc…). The financing options for the project include a standard long term loan as well as an overdraft facility and of course equity funding from investors.
Airport Operator Financial Model presents the business case of an already operating airport (with planned refurbishments) and an investment in a new terminal in the same airport. The model generates the three financial statements as well as the cash flows and calculates the relevant metrics (Discounted cash flows, Net Present Value, Internal Rate of Return, payback period, cash on cash multiple, enterprise value, etc…). The financing options for the project include a standard long term loan as well as an overdraft facility and of course equity funding from investors.
So a quick overview of the model, in the contents tab you can see the structure of the model and by clicking on any of the headlines to be redirected to the relevant worksheet.
On the manual tab, you are able to feed the general information for the model such as: project title, responsible, the timeline of the model and date and currency conventions.
Additionally, there is a description of the color-coding of the model in the same tab. Inputs are always depicted with a yellow fill and blue letters, call up (that is direct links from other cells) are filled in light blue with blue letters while calculations are depicted with white fill and black characters.
There is also a color coding for the various tabs of the model. Yellow tabs are mostly assumptions tabs, grey tabs are calculations tabs, blue tabs are outputs tabs (that is effectively results or graphs) and finally, light blue tabs are admin tabs (for example: the cover page, contents, and checks).
Guide Tab: This tab helps you to gain a grasp of the main value drivers and critical issues of the business.
Moving on to the Inputs (You have two sets of assumptions one for the existing terminal and for the new one…): detailed inputs for revenues (aeronautical charges, cargo & mail revenues, commercial revenues – nonaeronautical), costs splits between fixed (maintenance, material – utilities, marketing & advertisement, insurance, rescue fire fighting) and variable (Operator personnel, Airline support cost, purchased services, other), working capital (receivables, payables, and inventory), fixed assets and capex (split into existing terminal refurbishments and new terminal investment), equity financing as well as valuation assumptions (such as discount rates used in the weighted average cost of capital).
In the summary tab, you are able to see a high-level report with the main metrics and value drivers of the model. It can be readily printed on one page for your convenience.
Calculations: This is where all calculations are performed. The revenues for each terminal are calculated based on the passenger and cargo traffic and various yields used in the assumptions and deducting the operating costs adjusted for inflation the operating profit is resulting. Based on the assets financed and the gearing of the financing the interest and depreciation are occurring. By using the working capital assumptions the impact of the business cycle is presented. Finally depending on the level of the investment considered the relevant debt financing is calculated (Long term debt and overdraft).
In the Outputs tab: everything is aggregated here into the relevant statements: profit and loss, balance sheet and cash flow.
Moving to the Investment Metrics tab, a valuation is performed by using the free cash flows to the firm and then a series of investment metrics are presented (Net Present Value, Internal Rate of Return, Payback Period, Cash on Cash multiple). Additionally, the Debt Service Coverage Ratio and the Loan Life Coverage Ratio are presented.
In the Graphs tab: Various graphs present the investment and operating costs, the revenues, and the banking ratios (DSCR and LLCR). Then multiple charts present the performance of the project from revenues to bottom line along with debt, assets, working capital and cash flows which result in valuation on a project basis as well as on an equity basis together with the internal rate of return of the project and payback period metrics.
Checks: A dedicated worksheet that makes sure that everything is working as it should!
Important Notice: Yellow indicates inputs and assumptions that the user is able to change, blue cells are used for called up cells, and white cells with black characters indicates calculation cells.
Similar Products
Other customers were also interested in...
Airport Financial Model (Development, Operation &a...
Financial Model presenting a development and operating scenario of an Airport under a Public-Private... Read more
Start Up Seaplanes Operator Financial Model
Seaplanes Operator Financial Model consists of a financial model related to the start-up of a seapla... Read more
Airline Operator Financial Model
Airline Operator Financial Model presents the case of a company operating an airline business. The m... Read more
Airport | Airline Operator Financial Model Bundle
This Airport | Airline Operator Financial Model Template Bundle is best for those who are operating ... Read more
Air Taxi – Build and Operate Business Plan Model...
The flying taxi market is ready for takeoff, changing the travel experience forever. Fin-wiser’s A... Read more
Airlines DCF Valuation Model Template (3 Years Act...
Airlines Discounted Cash Flow (DCF) Valuation Model with 3 Years Actual and 5 Years forecast This... Read more
Project Finance – Toll Road – Build an...
Toll Road Build and Operate financial model is a project finance model for construction and operatio... Read more
Airline Company Financial Model – Dynamic 10 Yea...
Financial model presenting a business scenario of an Airline Company providing air transport service... Read more
Port Terminal Operator – Project Finance Mod...
Financial Model presenting a business scenario of a Port Operator with an existing terminal for Bulk... Read more
Private Aircraft Rental Company Financial Model
Embark on a journey to financial mastery with our Private Aircraft Rental Company Financial Model, w... Read more
Reviews
Thumbs Up
642 of 1266 people found this review helpful.
Help other customers find the most helpful reviews
Did you find this review helpful?
Thanks for your excellent financial models in various industries which help me to improve and excel my financial analysis ability
715 of 1386 people found this review helpful.
Help other customers find the most helpful reviews
Did you find this review helpful?
-
Dear CFO,
Thank you for you comment which is greatly appreciated.
Big4WallStreet Team
Thank you for your feedback.
670 of 1306 people found this review helpful.
You must log in to submit a review.


